How closely balanced are the rate of precipitation and the rate of evapotranspiration for each watershed in Minnesota?
 This index is important for understanding geomorphology because precipitation and surface runoff are the primary processes that act upon the earth’s surface. Soil erosion is driven either by wind or water, although wind erosion is thought to be small compared to water erosion (Leopold et al., 1964). The ability of water or wind to detach and transport soil particles is called erosivity. In water erosion, the erosivity depends primarily on the rainfall characteristics (Dalzell et al., 2004), usually estimated from the product of the maximum 30-min rainfall intensity and the amount of total energy in a storm event (Ward and Elliot, 1995). The erosion, transport, and deposition of soils modifies and reshapes landscapes and impacts stream channel processes (Montgomery and Buffington, 1998).Precipitation also plays a key role in determining the type and quantity of vegetation present. Increased precipitation leads to increased vegetation mass; whereas changes in humidity levels lead to changes in vegetation type (Leopold et al., 1964). This may create feedbacks where vegetation change affects evapotranspiration, annual runoff, and water levels in streams and lakes.
Why is this important for geomorphology?
The relationship between precipitation and evapotranspiration reflects statewide climatic conditions that may influence water availability. A system that tends to have more precipitation than evapotranspiration may have water available for storage and surface runoff. A system that tends toward a water deficit will have less water for above and below ground storage and runoff. It is important to know where in Minnesota there is an inherent tendency toward water surplus or shortage, as extreme weather events and long-term precipitation trends will have a different impact among watersheds due to this background condition (Novotany and Stefan, 2005).The relationship between precipitation and evapotranspiration is influenced by many factors, such as soil water capacity, canopy type, leaf area, the intensity and type of precipitation, solar energy gain, and latitude. The rate of evapotranspiration will also adjust as the soil moisture conditions change (Chapin, 2002). Given the complexity of this relationship, this index is a surrogate for more detailed climate data that will more accurately reflect vulnerability to extreme climate events and future climate trends.Climate Vulnerability Health Scores
Creating the Index
- Input Data
- Calculating the index
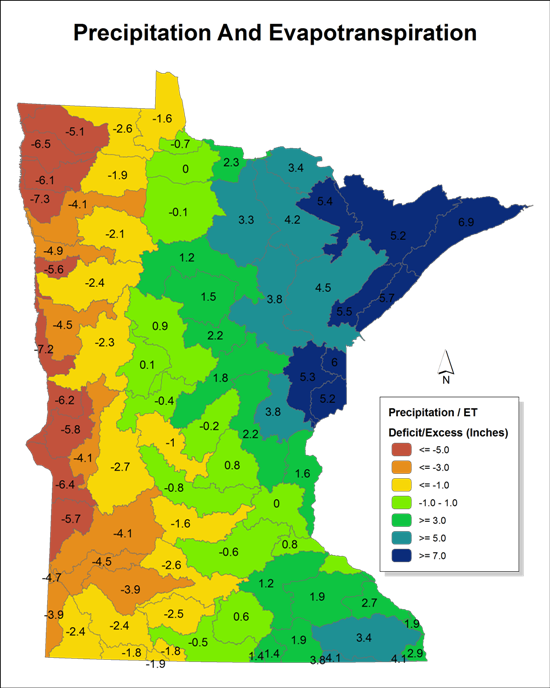
- This index uses a calculated water balance based on normal annual precipitation and evapotranspiration rates for Minnesota, climate data from 1961-1990. Precipitation data were collected from a range of sites, quality verified, and statewide precipitation estimated from these point measurements for each day across the averaging period. Potential evaporation values, the amount of water that would evaporate from an open pond or other water body, were estimated from a similar observation network. Precipitation minus potential evaporation was used to calculate the index. More information about this research can be found at: https://www.dnr.state.mn.us/climate/water_availability.htmlThis statewide grid of calculated values shows the moisture balance between precipitation and evapotranspiration reflecting either a deficit or excess of moisture. The range of values found within each watershed was summarized into a mean watershed value.
Ranking and scoring
The amount of deviation from “0”, or a balanced state, was used to score an increased vulnerability to climate extremes. The absolute value of the results was used to generate the score so that either a deficit or surplus of moisture was scored as having an equal impact on climate vulnerability. A deviation of 7.5 inches resulted in a score of 0 to reflect the greatest vulnerability to climate extremes. The northwestern and northeastern border areas of Minnesota received the lowest scores. Those watersheds with a more balanced water supply occur along a north – south line through the center of Minnesota and received the highest scores.- 0-20 - High vulnerability to climate variation
- 21-40 - Significant vulnerability to climate variation
- 41-60 - Moderate vulnerability to climate variation
- 61-80 - Slight vulnerability to climate variation
- 81-100 - Least vulnerability to climate variation
Index Results
- Interpretation of results
- There is a west to east gradient that shows a deficit in moisture in western Minnesota, compared to a surplus of moisture in the east. The range shows a nearly equivalent range in negative and positive values, with a deficit of -7.3 inches to a surplus of 7.5 inches.Due to its position in the center of the continent, Minnesota is located on the boundary between the semi-arid climate of western U.S. and the semi-humid climate to the east. Given the range of climate conditions, a change in precipitation and /or temperature trends will have different impacts in different parts of Minnesota. Drier, warmer, wetter, cooler in any combination will create a different outcome scenario in each region of the state.
- Relationship to other health components
Hydrology
Precipitation is the major water input to a watershed and the most significant component of the hydrological budget. In the U.S., rain and snow are the most and second most common forms of precipitation. By some calculations, the United States as a whole receives 30 inches of precipitation annually; 21 inches of which are returned to the atmosphere as evapotranspiration. The remaining 9 inches become stream flow, ground water recharge, or seep to the ocean. The annual mean difference between precipitation and evapotranspiration can tell us whether a region is humid or dry: a positive value of P – ET indicates humid climate, and a negative value of P – ET denotes dry climate.Water Quality
The amount of water available as surface runoff is largely determined by the rate of evapotranspiration. Surface runoff will wash soils, chemicals and other materials into surface waterbodies. Leopold et. al (1964) found in selected rivers throughout the United States that when precipitation is higher, there is more runoff; therefore, more mobilization of sediment and dissolved phosphorus.Connectivity
Stream flow, groundwater flow and aquifer recharge are dependent on precipitation, which may be affected by climate change. If precipitation is reduced or transpiration increases, stream flow may be reduced to the point that aquatic connectivity is also reduced. Reduced streamflow and higher temperatures could impact dissolved oxygen concentrations in streams, which could limit movement of aquatic organisms.Biology
Precipitation has a fundamental effect on vegetation quantity and type and there is a linear relationship between precipitation and vegetation mass of deserts, grasslands and forests.
Supporting Science
- Scientific literature support
- A large body of scientific work has established the main components of the water cycle, driven by the balance between precipitation and evapotranspiration (Brooks et al., 2003). These two primary factors vary in space and time; as a result, vegetation, geomorphology, and human economies have developed in response to these primary driving factors.Vulnerability is caused by both either excess precipitation, which causes flooding, or precipitation deficit, which causes drought. Excess and deficit are relative to evaporation and transpiration, controlled primarily by the climatic factors including solar radiation, temperature, and atmospheric humidity. Increasing storm intensity or average rainfalls, or increasing temperatures and periods of low rainfall, may be more likely in the future given recent retrospective analyses of Minnesota climate records.One analysis (Novotny and Stefen, 2007) analyzed long-term, quality-controlled time series of climate data and flow records across Minnesota. They found that both precipitation and flow volume have been increasing for the past five decades. They also noted that flow variability was increasing, with a significant upward trend in both the number of high-rainfall days and low rainfall days, clustered in periodic cycles. In short, rainfall was increasing, but so was the length of droughts during dry periods, resulting in higher base flows and higher peak flows and a higher frequency of extreme low flow events. They also found that flow has increased more than could be accounted for by the increase in precipitation, perhaps due to another climate variable (e.g., greater cloudiness or higher atmospheric humidity) or to changes in vegetation or withdrawals.Stream and lake biotic communities are vulnerable to climatic variability because flow regimes help determine the type and abundance of aquatic organisms (Horwitz, 1978). For example, fish species numbers tend to increase as flow variability decreases, perhaps due to an increase in the number of different habitats available, and perhaps due to “drift loss,” which is the number of organisms, particularly young, swept irreversibly downstream during high flow events. Alternately, some species are harmed by low flow, unable to live in pools or shallow water or by warmer water temperatures often associated with summer low flow periods.
- Confidence in index
- There is little scientific literature to support the specific index developed here, or the thresholds and categories established. However, the relationship between precipitation and evapotranspiration is a well established indicator of water availability. The data used for this index are based on an annual mean value over a thirty-year period of record. The summary of results by major watershed may not fully reflect the west to east climate variability that exists within each watershed, but the comparative value between watersheds reflects the climates across the state. The use of this index as an indicator of climate vulnerability is less well documented. While more variable flow rates at both high and low values have potentially negative impacts, the current index is a very coarse measure of variability, averaged over a long time period, and centered on balanced precipitation/evapotranspiration. This may not be a good measure of either high or low-flow variability, particularly variability that is relevant to stream or lake biota, stream geomorphology, or other factors affected by flow regimes.
Next Steps
- Future enhancements
- This index should be improved over time with a specific analysis of the impacts of flow variability on hydrologic variables of interest, and the vulnerabilities of these variables to specific climatic conditions. For example, Horwitz (1978) found decreasing fish diversity and Clausen and Biggs (1997) found lower periphyton diversity at lower flow velocities and flow variabilities. A recent review discussed a number of indices used for characterizing flow regimes (Olden and Poff, 2003), many of which have been used to estimate thresholds for avoiding negative flow-related effects or protecting valuable hydrologic resources. A candidate set of indices should be evaluated related to specific, measured or modeled flow variability statistics that reflect specific flow variability threats (e.g., increased drift or temperature-induced mortality).An improved index would require additional data collection and/or analysis to increase the temporal and spatial detail of the index. This will include estimating the frequency of high and low-flow events for each watershed, and associated mapping of related climatic conditions at more frequent intervals and across the state. This may require modeling other processes; for example, soil moisture or annual snow accumulation for runoff indices that includes soil moisture.