A monthly electronic newsletter summarizing Minnesota's climate conditions and the resulting impact on water resources. Distributed on the first Thursday of the month.
State Climatology Office - DNR Division of Ecological and Water Resources, St. Paul
distributed: December 11, 2019
What happened in November 2019:
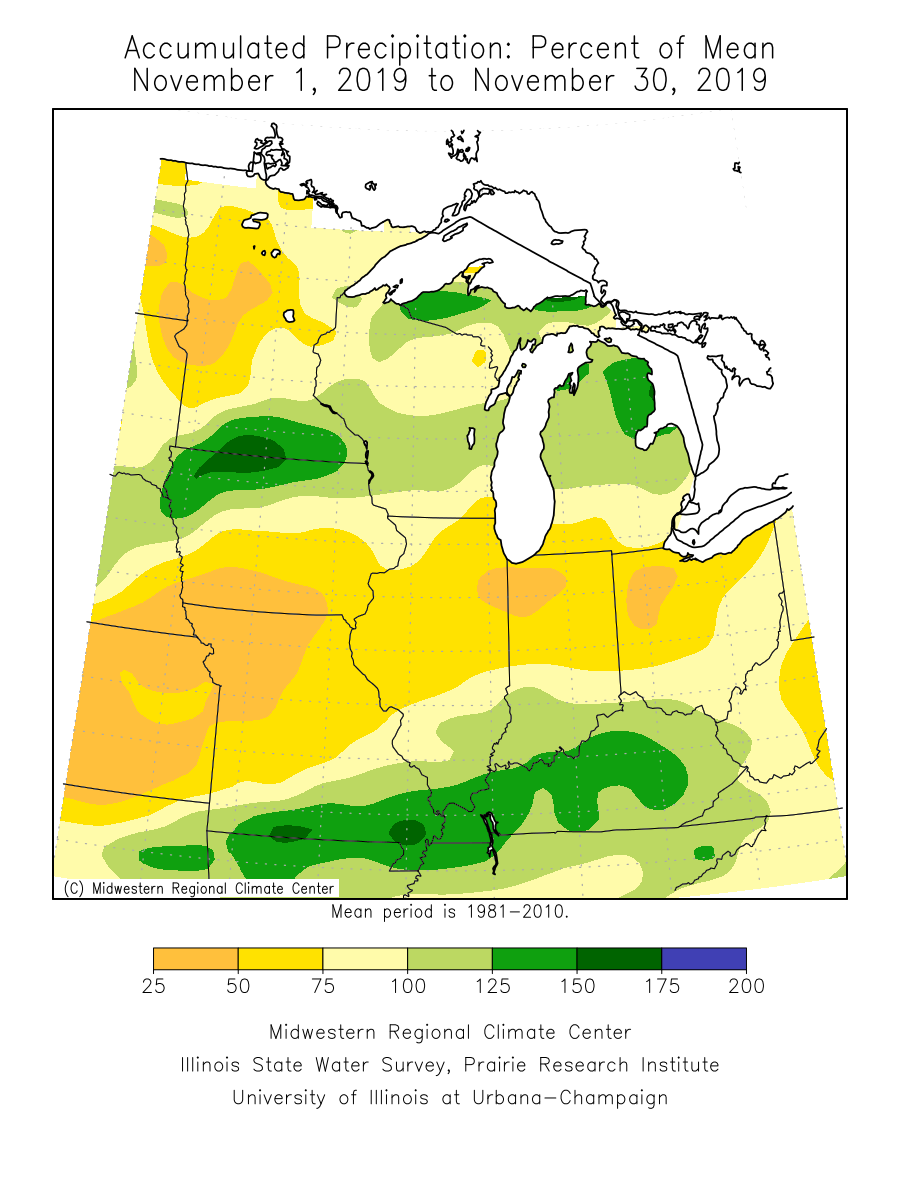
- November 2019 was a cool and snowy month, but overall precipitation fell a bit short across the state. The driest locations were in western Minnesota. South central parts of the state saw the most moisture. One of the wettest locations was at Austin where the November total was 3.02 inches or a little over an inch above normal.
[see: November 2019 Preliminary Precipitation Total Map | November 2019 Precipitation Departure Map | November 2019 Climate Summary Table | November 2019 Percent of Normal Precipitation Map] - There were two significant precipitation events in November:
- A strong winter storm struck central and southern Minnesota, along with areas near Lake Superior, during the overnight and early morning hours on November 26th and 27th. This well-advertised storm produced widespread snowfall totals of six to nine inches, along with wind gusts in excess of 35 mph. The University of Minnesota preemptively closed for Wednesday the 27th, and many schools and business opted to take the day off as well.
[see: Heavy Snow: November 26-27, 2019] - The second major winter storm happened on Thanksgiving weekend. The storm began Friday, November 29 in southern Minnesota with several inches of snowfall and then on the 30th the focus of the heavy snow shifted north. By Sunday December 1st snowfall accumulations of 8-16 inches were common across the northern half of Minnesota, with pockets of higher totals around Cloquet, Duluth, and just off the north shore of Lake Superior. This was Minnesota's first major Thanksgiving weekend winter storm since 1994. One of the highest totals was 21.7 inches at Duluth. The heavy accumulation of snow and ice on the Duluth lift bridge caused it to be inoperable for two days.
[see: The 2019 Thanksgiving Weekend Winter Storm] - November was the second below normal month in a row. The preliminary average statewide temperature was 26.1 degrees or 3.1 degrees colder than normal. Last November the departure was 6.4 degrees below normal. The coldest reading for November 2019 was -21F at Isabella on the 12th. The warmest high temperature reading was 55 degrees at Windom in southwest Minnesota on the 21st
[see: November 2019 Climate Summary Table | 2019 November Departure from Normal Temperature Map]
Where we stand now:
- As of December 11, 2019 there is a robust snowpack across much of the state. The deepest snow cover is in northeast Minnesota, where some places along the north shore have two feet of snow on the ground. Across the rest of the state, many places have four to eight inches of snow cover. This is above the historical median for the date. Many took advantage of the early snow cover for winter recreation.
[see: NWS Snow Depth Estimation Map | Midwest Regional Climate Center Snow Depth Map| MNDNR Snow Depth Maps] - The US Drought Monitor Map released on December 3 depicts Minnesota free of any drought designation. Last year at this time a small area in Northwest Minnesota in Abnormally Dry conditions. This is a reduction over the previous week. The U.S. Drought Monitor index is a blend of science and subjectivity where drought categories (Moderate, Severe, etc.) are based on several indicators.
[see: Drought Conditions Overview] - Ice is affecting many streams across Minnesota, especially across the central and north. Where there is some open water the U.S. Geological Survey reports that stream discharge values are high or much above normal across central and southern Minnesota.
[see: USGS Stream Flow Conditions] - On December 1 the level of Mille Lacs was well above the median for the date and has been above the median since May 2018. The approximate date of lake ice in for Mille Lacs was December 2. Lake Minnetonka was still in drawdown mode and on December 11 was 928.71 feet with 150 cfs at Grays Bay Dam. White Bear Lake is now ice covered and was at 925.07 feet on December 11. The current level of White Bear Lake is 6.23 feet higher than the record low level 918.84 measured on January 10, 2013. Water has been flowing out of the outlet of White Bear Lake since April. Rainy and Lake of the Woods continue to be above median range for early December. Lake Superior was at 602.92 feet on December 6, fourteen inches higher than the monthly average for early December.
[see: Mille Lacs Lake Water Level | Lake Minnetonka Water Level | White Bear Lake Water Level | Lake of the Woods Control Board Basin Data | Corps of Engineers Great Lakes Water Levels] - The Agricultural Statistics Service on November 24 reports that topsoil moisture across Minnesota is 0 percent Very Short, 1 percent Short, 66 percent Adequate, and 35 percent Surplus. Corn for grain harvest was at 93% complete on December 9 and was three weeks behind the five-year average. Soil moisture levels at Lamberton and Waseca were above the historical median for the last report in early November.
[see: Agricultural Statistics Service Crop Progress and Condition | U. of M. Southwest Research and Outreach Center (Lamberton) | U. of M. Southern Research and Outreach Center (Waseca)] - The potential for wildfires is currently rated by DNR Forestry as Low across Minnesota. Historically, 80 percent of all wildfires in Minnesota occur during April and May.
[see: Fire Danger Rating Map] - Soils froze over during the early part of November, then with the thaw during the third week of the month, much of the frost melted over central and southern Minnesota. Snow during the last week of November fell on unfrozen ground and is causing a delay in soil freeze. Most places under sod have frost depths from two to four inches. Soil temperatures at four inches under sod are in the low to mid 30’s.
[see: National Weather Service Frost Depth Data | National Weather Service Soil Temperature Data
Future prospects:
- The December precipitation outlook that was released on November 30 has all of Minnesota and the Upper Midwest pegged to have a tendency for above normal precipitation.
[see: Climate Prediction Center 30-day Outlook | December Precipitation Normal Map] - The December temperature trend (according to the Climate Prediction center has a fairly strong tendency for above normal temperatures statewide. Normal December high temperatures are in the upper 20's to low 30's to start the month, dropping to the low to mid 20's by month's end. Normal lows are in the teens early in the month, falling to single digits by late December.
[see: Climate Prediction Center 30-day Outlook | December Temperature Normal Map] - The 90-day temperature outlook for December through February shows equal chances for below, above and normal temperature. The 90-day precipitation outlook for December through February indicates a strong tendency for above normal precipitation. Perhaps the snowy winter will continue.
[see: Climate Prediction Center 90-day Outlook] - The National Weather Service produces long-range probabilistic river stage and discharge outlooks for the Red River, Minnesota River, and Mississippi River basins. These products address both high flow and low flow probabilities.
[see: National Weather Service - North Central River Forecast Center]
From the author:
- November started out quite cold with many lakes and ponds freezing over at the end of the first week of November, which would be several weeks ahead of the median dates for some locations. However, mild weather thawed many lakes and ponds in southern Minnesota. In central Minnesota, some thawed and others held onto their ice. Then with the return of cooler weather and calm conditions, many lakes froze up on December 2.
[see: Median Lake Ice in Dates]
Upcoming dates of note:
- December 19: National Weather Service releases 30/90 day temperature and precipitation outlooks
![]() Subscribe to email announcements of the monthly posting of this product.
Subscribe to email announcements of the monthly posting of this product.
Pete Boulay, DNR Climatologist