A monthly electronic newsletter summarizing Minnesota's climate conditions and the resulting impact on water resources. Distributed on the first Thursday of the month.
State Climatology Office - DNR Division of Ecological and Water Resources, St. Paul
distributed: January 24, 2024
What happened in December 2023:
- December 2023 was the warmest and wettest on record in Minnesota back to when statewide statistics began to be compiled in 1895. The preliminary average statewide precipitation total was 2.06 inches or 1.02 inches above normal. No month in history back to 1895 has achieved top rankings for both temperature and precipitation. The closest was August of 1900, which was the wettest and the 4th-warmest August on record. December of 2015 had been the warmest and fourth-wettest December on record, but obviously was bumped down to #2 and #5, respectively. Despite the wet finish, 2023 was the fourth year in a row below the 1991-2020 normal precipitation.
[see: December 2023 Preliminary Precipitation Total Map | December 2023 Precipitation Departure Map | December 2023 Climate Summary Table] - December 2023 was quiet for snowstorms, but there was one large event.
- An extremely warm and humid winter air mass obliterated temperature, dew point, and even some precipitation records on Christmas Eve and Christmas Day, 2023, across Minnesota.
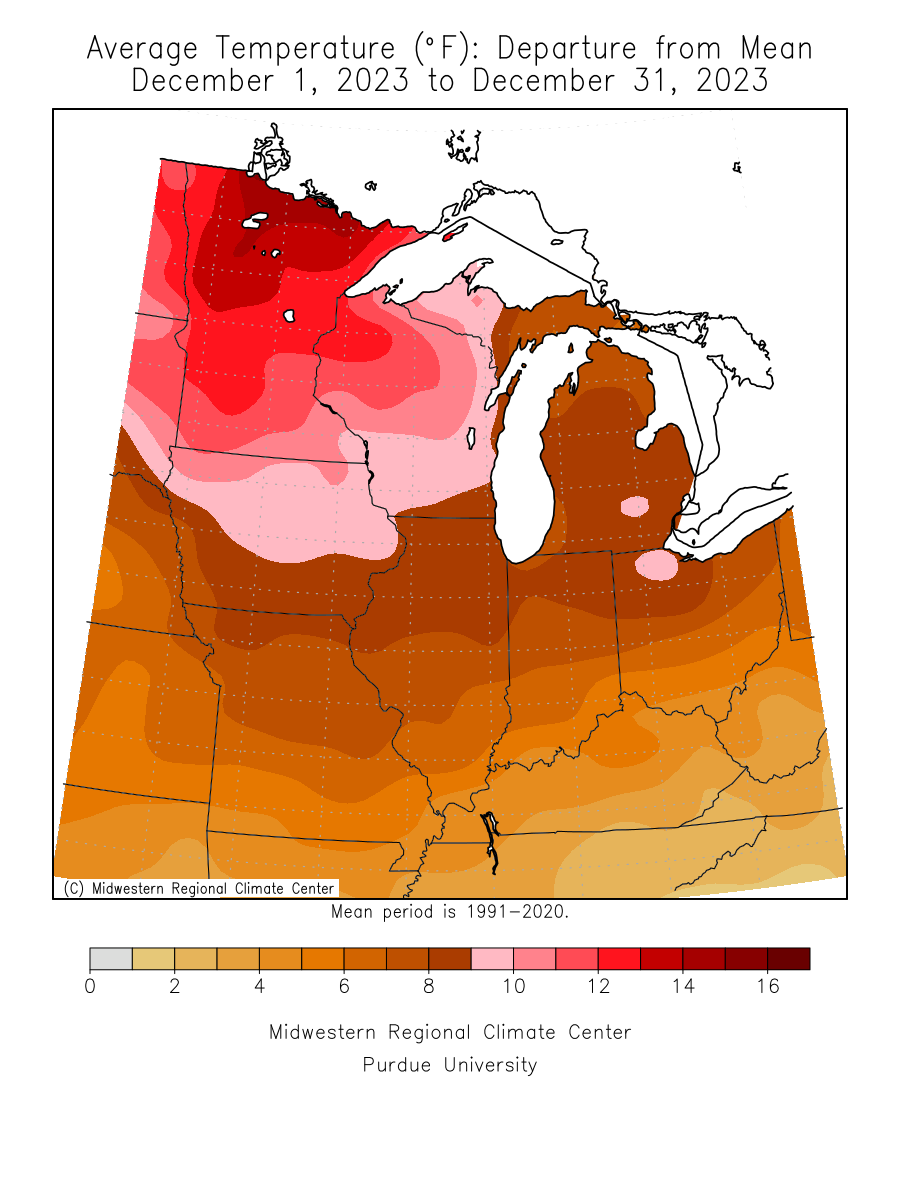
[see: Soaking-Wet Holiday Heat Wave!] - The last five out of six Decembers, 2018-2023 have all had above normal statewide temperatures, except December 2022. December 2023 finished 29.2 degrees F, or 12.2 degrees above normal. Climatologists scoured old records to compare December 2023 with the past. December 2023 was warmer than the famous December 1877 in the Twin Cities by a half of a degree. The average temperature for December 18877 was 33.8 degrees and December 2023 was 34.3 degrees. At Morris, with records back to 1886, the mean temperature for December 2023 was 30.9 degrees, which broke the old record of 27 degrees from 1959. The warmest temperature of the month was 68 degrees at Canby on December 8 and the coldest reading found so far was -4 degrees F at three locations in northern Minnesota.
[see: December 2023 Climate Summary Table | 2023 December Departure from Normal Temperature Map]
Where we stand now:
- The recreational snow season had a very late start and was non-existed in December, with most of the state seeing bare ground at the end of the month. Some hope came with a snow event from January 7-9, 2024 that brought a swath of snow from southwest to northeast Minnesota. On January 18, the snow depth ranking was in the 20th percentile or lower across much of northern and central Minnesota. Places along the Iowa border were in the 60th to 80th percentile.
[see: Weekly Snow Depth and Ranking Maps | NWS Snow Depth Estimation Map | Midwest Regional Climate Center Snow Depth Map] - The Exceedingly wet December improved the drought situation. In Mid-January, 2024, there is a large area in west central and central Minnesota with no drought designation at all, while the drought from 2023 lingers on for other parts of the state. The U. S. Drought Monitor map released on January 16, 2024 depicts 15% of the state free of drought designation. About 45% of the state was Abnormally Dry, and 28% of the state in Moderate Drought conditions, 12% in Severe Drought conditions and .3% in Extreme Drought conditions. The U.S. Drought Monitor index is a blend of science and subjectivity where drought categories (Moderate, Severe, etc.) are based on several indicators.
[see: Drought Conditions Overview] - The U.S. Geological Survey reports that stream discharge values in Minnesota (where winter measurements are possible) are normal, to much above historical medians. Most rivers and streams are impacted by ice.
[see: USGS Stream Flow Conditions] - Lakes had a good start to freeze-up with many freezing over at the end of November, 2023. Then the record warm December happened and a number of lakes lost their ice. Quite a few did not refreeze until the first or second week of January 2024. The lakes also saw a bit of a bump up with the wet December. Mille Lacs was just about a tenth of a foot below the median on January 23, 2024. Lake Minnetonka was at 298.70 feet, a rise of 1.37 feet from January 2023. White Bear Lake was at 922.17 in early January 2023 and was .25 feet lower than early January 2023. Lake of the Woods is on the low end of the median band and Rainy Lake is in the middle of the median band, Lake Superior was forecasted to be 601.44 feet, on January 19, 2024 eight inches lower than the same date in 2023 and one inch lower than the long-term average for January.
[see: Mille Lacs Lake Water Level | Lake Minnetonka Water Level | White Bear Lake Water Level | Lake of the Woods Control Board Basin Data | Corps of Engineers Great Lakes Water Levels] - In their final report for the season, On November 27, 2023 the Agricultural Statistics Service reported that topsoil moisture across Minnesota was 9 percent Very Short, 27 percent Short, 60 percent Adequate, and 4 percent Surplus. Corn for grain harvest was 97% completed by November 19, on pace with 2022 and one week ahead of the five year average. Soil moisture levels at Lamberton on November 15 showed a one-inch surplus compared to the median going into freeze-up.
[see: Agricultural Statistics Service Crop Progress and Condition | U. of M. Southwest Research & Outreach Center (Lamberton) | U. of M. Southern Research & Outreach Center (Waseca)] - The potential for wildfires is currently rated by DNR Forestry as Low across Minnesota.
[see: Fire Danger Rating Map] - Soil frost depths under sod are fairly shallow for January, with generally a half foot or less over southern Minnesota about a foot to twenty inches in the Twin Cities, and about a foot and a half to two feet of frost in the north. Frost had a late start, but the scant snow cover in parts of the state allowed the frost to deepen rapidly in mid-January Historically, the deepest frost occurs in late February to early March.
[see: National Weather Service Frost Depth Data | University of Minnesota - St. Paul Campus Soil Temperatures Under Sod] - The lake ice season got to a good start in late November, then the record warm December caused may lakes to reopen. The arrival of “real” winter temperatures in early to mid-January frozen over these open lakes. Quite a few lakes set late lake ice in records.
[see: DNR Conservation Officer Reports | 2023 Ice-In Dates] | Median Lake Ice-In Dates]
Future prospects:
- Typically the discussion here is for the January precipitation outlook, however, do the lateness of this Hydroclim, the February outlook is discussed here. The outlook issued on Jan 18th showed equal chances for below, normal and above normal precipitation over the state. Precipitation normal for February range from near one-half inch of liquid equivalent in western Minnesota to just over three-quarter of an inch of precipitation in eastern sections of the state. The median snow cover at the end of January ranges from near five inches in southwest Minnesota, to over 15 inches on the ground in northeastern Minnesota (greater than 24 inches along the Lake Superior highlands).
[see: Climate Prediction Center 30-day Outlook | January Precipitation Normal Map] - The February temperature outlook has a familiar ring to it with a tilt for above normal temperatures, not only in Minnesota, but for the surrounding states as well. Normal February high temperatures range from the low teens in the north to near 20 in the south early in the month, climbing to the mid-20s to low 30s by month's end. Normal February low temperatures range from near minus 10 degrees in the far north to the single digits above zero in southern Minnesota early in the month; ascending to the low single digits in the north, mid-teens in the south by the end of February.
[see: Climate Prediction Center 30-day Outlook | Temperature Normals] - The 90-day temperature outlook for February through April has a tendency for above normal temperatures across the entire state. The 90-day precipitation outlook for December through February indicates equal chances for above, below and normal precipitation.
[see: Climate Prediction Center 90-day Outlook] - The National Weather Service produces long-range probabilistic river stage and discharge outlooks for the Red River, Minnesota River, and Mississippi River basins. These products address both high flow and low flow probabilities.
[see: National Weather Service - North Central River Forecast Center]
Watercooler Talk in the Climate Office:
- Have we seen the end of winter? A January thaw is upon the state and is projected to continue into February. Hard to say what will happen for the winter after that. Will we have the warmest December-February on record? In order for that to happen, we would need the assist of an above normal February. Stay tuned! The link below has statistics of January Thaws going back to 1873. The longest January Thaw (including part of December) is 21 days, from 2006-07. [see: Behold, The January Thaw!]
Upcoming dates of note:
- January 18: National Weather Service releases 30/90 day temperature and precipitation outlooks
![]() Subscribe to email announcements of the monthly posting of this product.
Subscribe to email announcements of the monthly posting of this product.
Pete Boulay, DNR Climatologist