A monthly electronic newsletter summarizing Minnesota's climate conditions and the resulting impact on water resources. Distributed on the first Thursday of the month.
State Climatology Office - DNR Division of Ecological and Water Resources, St. Paul
distributed: November 15, 2023
What happened in October 2023:
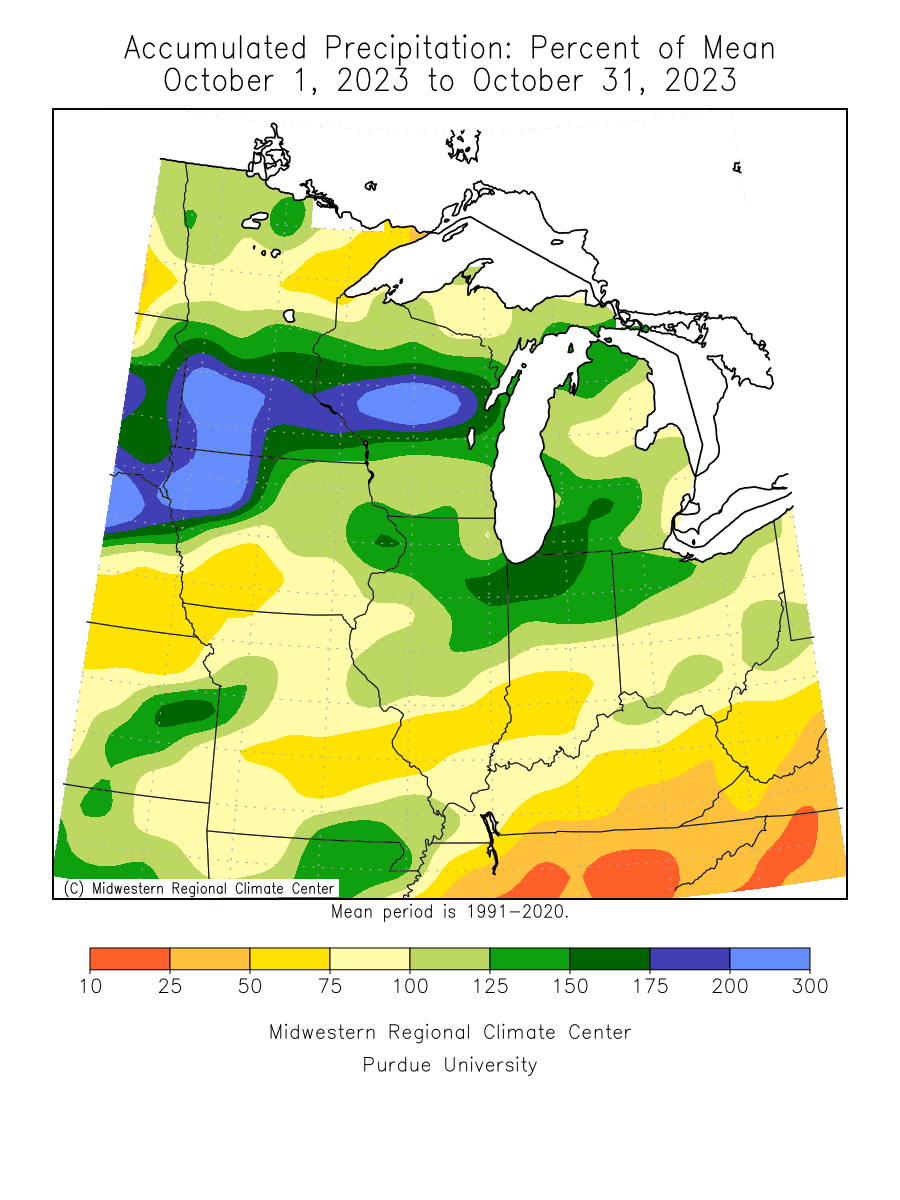
- October 2023 was much wetter across the state than in October 2022, especially in the south. The preliminary statewide average was 3.41 inches or .88 inches above normal. The wettest areas were in the Minnesota River Valley, where some places saw precipitation of three inches or more above normal. One of the wettest locations found so far was Lamberton in Redwood County in southeast Minnesota that had 6.38 inches of precipitation or 4.12 inches above normal. The driest locations where in the far northeast and northeast parts of the state, where precipitation totals were less than an inch for the month. One of the driest locations found so far was .77 inches at Grand Portage in Cook County.
[see: October 2023 Precipitation Total Map | October 2023 Precipitation Departure Map | October 2023 Climate Summary Table | October 2023 Percent of Normal Precipitation Map] - Several precipitation events during the month of October assisted the drought recovery. The largest was from October 12-14, where a widespread soaking rain dropped one to three inches of rainfall over much of southern and central Minnesota.
[see: Another Helpful Soaking in Southern Minnesota] - The Gales of November came early during the week of October 23-28th when a complex weather system produced heavy thunderstorms, strong winds and the first significant accumulating snowfall for the state. As the cold air streamed into Minnesota, accumulating snows developed across the far northwest and north. Lake Bronson reported 8.2 inches of snow, with 6.2 inches in Thorhult, 5.2 inches at Warroad, and 4.5 inches at Norris Camp. International Falls reported 3.5 inches of accumulation for the event.
[see: Thunderstorms, Gales, and the State's First Snowfall!] - The active month of October wasn’t quite done yet, with many people waking up to snow on the ground on Halloween morning. A compact low-pressure system had just enough cold air with it to drop 2.7 inches of snow in the Twin Cities, with higher amounts along the north shore of Lake Superior.
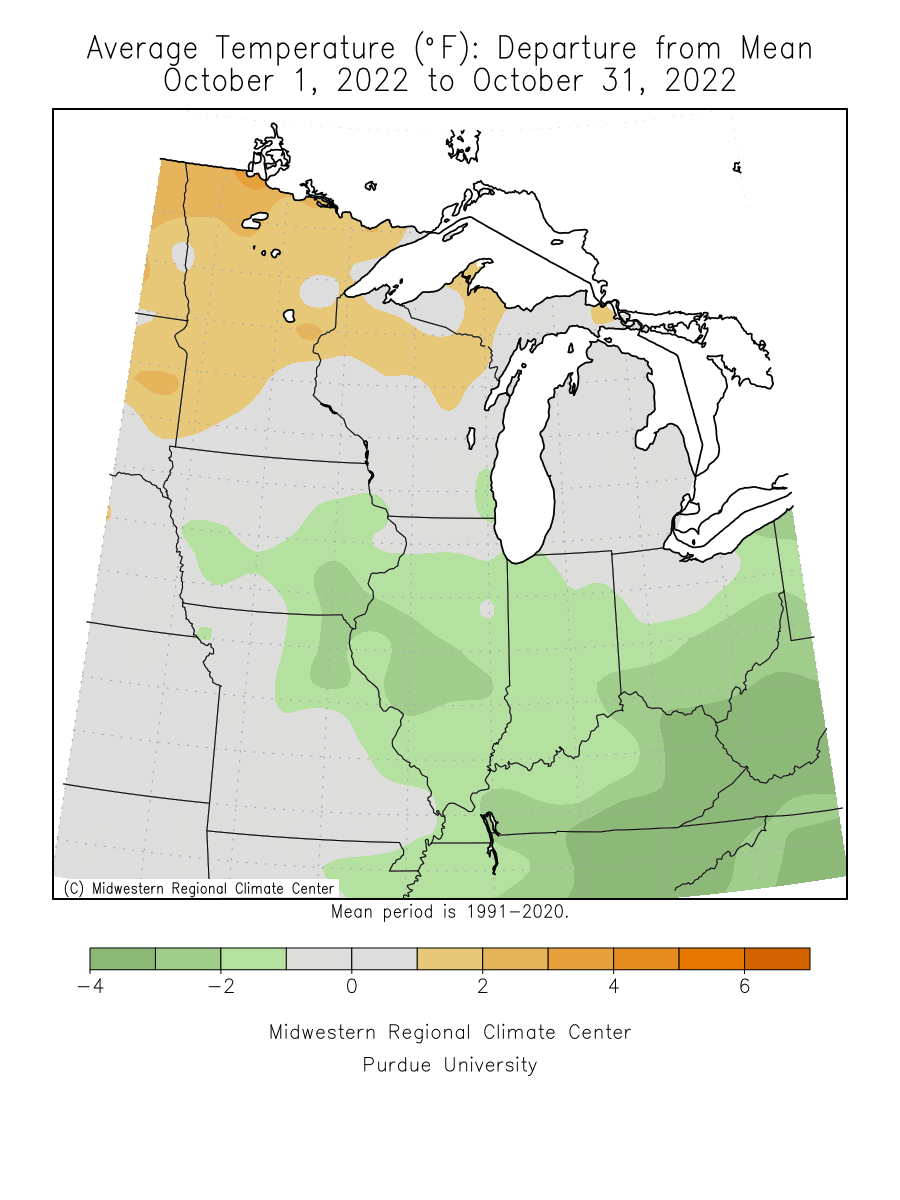
[see: Halloween Snow!] - October 2023 was another month in a row of above normal temperatures. The preliminary statewide average temperature was 48.5 degrees or about two-and-a-half degrees above normal. This was the third October in a row to finish above normal. The highest temperature for October 2023 found so far was 95 degrees at Milan and Lamberton in southwest Minnesota on October 1, and the coldest reading found so far was 5 degrees at Hibbing on October 31.
[see: October 2023 Climate Summary Table | 2023 October Departure from Normal Temperature Map]
Where we stand now:
- Seasonal precipitation totals (April 1 through November 14) ranked above the historical median over scattered areas along the Minnesota River, in Big Stone County and in the vicinity of Duluth. On the dry side, areas including the Mississippi River upstream of St. Cloud and south of I-90 along the border of Iowa are in the 20th percentile or less.
[see: Seasonal Precipitation Ranking Maps] - The U. S. Drought Monitor map released on November 7, depicts that 10% of the state is free of any drought designation. 46% of the state in the Abnormally Dry category, 26% in the Moderate Drought category, 18% in the Severe Drought category and .3% in the Extreme Drought category. The state in general, has less severe and extreme drought coverage than last year at this time. The U.S. Drought Monitor index is a blend of science and subjectivity where drought categories (Moderate, Severe, etc.) are based on several indicators.
[see: Drought Conditions Overview] - The U.S. Geological Survey reports that stream discharge values on November 15 have stayed fairly consistent over the past week or two. The Mississippi River in general, upstream from the Twin Cities continues to flow below historical averages. The Red River of the North is flowing above historical averages. The Minnesota River is in the normal percentile and is above normal at Ortonville.
[see: USGS Stream Flow Conditions] - Water levels on most Minnesota lakes vary depending on lake and location in the state. Mille Lacs on November 15 was at 10.47 feet, about .37 feet below the median for this time of year. On November 15, Minnetonka was at 928.46 feet, slightly below the median but a foot higher than last year at this time. White Bear Lake was at 922.19 feet on November 15, a fall of just over a foot from a year ago at this time. Rainy Lake and Lake of the Woods are in the low end of the median band. Lake Superior was forecast to be at 601.90 on November 10, six inches lower than this time yeast year and one inch lower than the long term monthly average for early November. The projected net change by December 10, 2023 is a fall of three inches.
[see: Mille Lacs Lake Water Level | Lake Minnetonka Water Level | White Bear Lake Water Level | Lake of the Woods Control Board Basin Data | Corps of Engineers Great Lakes Water Levels] - The Agricultural Statistics Service on November 13 reports that topsoil moisture across Minnesota is 10 percent Very Short, 26 percent Short, 59 percent Adequate, and 4 percent Surplus. Soil moisture levels at Lamberton on November 1 showed a rebound in soil moisture that began in mid-October and as of November 1 there was a surplus of 1.65 inches, showing that there is good soil moisture for next season.
[see: Agricultural Statistics Service Crop Progress and Condition | U. of M. Southwest Research and Outreach Center (Lamberton) | U. of M. Southern Research and Outreach Center (Waseca)] - The potential for wildfires on November 15, 2023 is currently rated by DNR Forestry as Low across northern Minnesota and Moderate over southern and central parts of the state. Historically, 80 percent of all wildfires in Minnesota occur during April and May.
[see: Fire Danger Rating Map]
Future prospects:
- The November precipitation outlook leans towards equal chances of above, normal and below normal precipitation. November precipitation normals range from about three-quarters of an inch in northwest Minnesota to about two-and-a-half inches in Cook County. Southern and central Minnesota range by about one-and-a-quarter of an inch in the southwest to about two-inches and a quarter in south central Minnesota.
[see: Climate Prediction Center 30-day Outlook | November Precipitation Normal Map] - The November temperature outlook also leans towards equal chances of above, normal and below normal temperatures statewide. Normal November high temperatures are in the 40s to start the month, dropping to the 30s by month's end. Normal lows are in the 30s to upper 20s early in the month, falling to the teens by late November.
[see: Climate Prediction Center 30-day Outlook | November Temperature Normal Map] - The 90-day temperature outlook for November through January is leaning towards above normal temperatures, with a slight tendency for below normal precipitation over the northwest. The rest of the state has equal chances of above, normal and below normal precipitation.
[see: Climate Prediction Center 90-day Outlook] - The National Weather Service produces long-range probabilistic river stage and discharge outlooks for the Red River, Minnesota River, and Mississippi River basins. These products address both high flow and low flow probabilities.
[see: National Weather Service - North Central River Forecast Center]
From the author:
- Moderate to strong El Niño conditions are here and are forecast to persist into 2024. What does this mean for the winter? In Minnesota, El Niño conditions have tended to produce mild winters with less snow than average. The 25 El Niño winters since 1950 averaged 1.8 degrees F warmer on a statewide basis than non-El Niño winters, and have produced an average of 22% less snow (12.7 inches) in the Twin Cities. The warmest December-through-February on record in Minnesota came during the very strong 1997-98 El Niño episode. The very strong events in 2015-16 and 1982-83; the strong El Niño in 1991-92; and the moderate one in 1986-87, also are associated with winters that are among Minnesota's 10 warmest on record. The moral of the story is that El Niño tends to yield mild and low-snow winters, but extremely cold and extremely snowy exceptions are always just an Arctic cold front away in Minnesota! . [see: "El Niño" is Coming. What Might That Mean for Minnesota's Weather?]
Upcoming dates of note:
- November 16: National Weather Service releases 30/90 day temperature and precipitation outlooks
![]() Subscribe to email announcements of the monthly posting of this product.
Subscribe to email announcements of the monthly posting of this product.
Pete Boulay, DNR Climatologist