A monthly electronic newsletter summarizing Minnesota's climate conditions and the resulting impact on water resources. Distributed on the first Thursday of the month.
State Climatology Office - DNR Division of Ecological and Water Resources, St. Paul
distributed: June 7, 2018
What happened in May 2018:
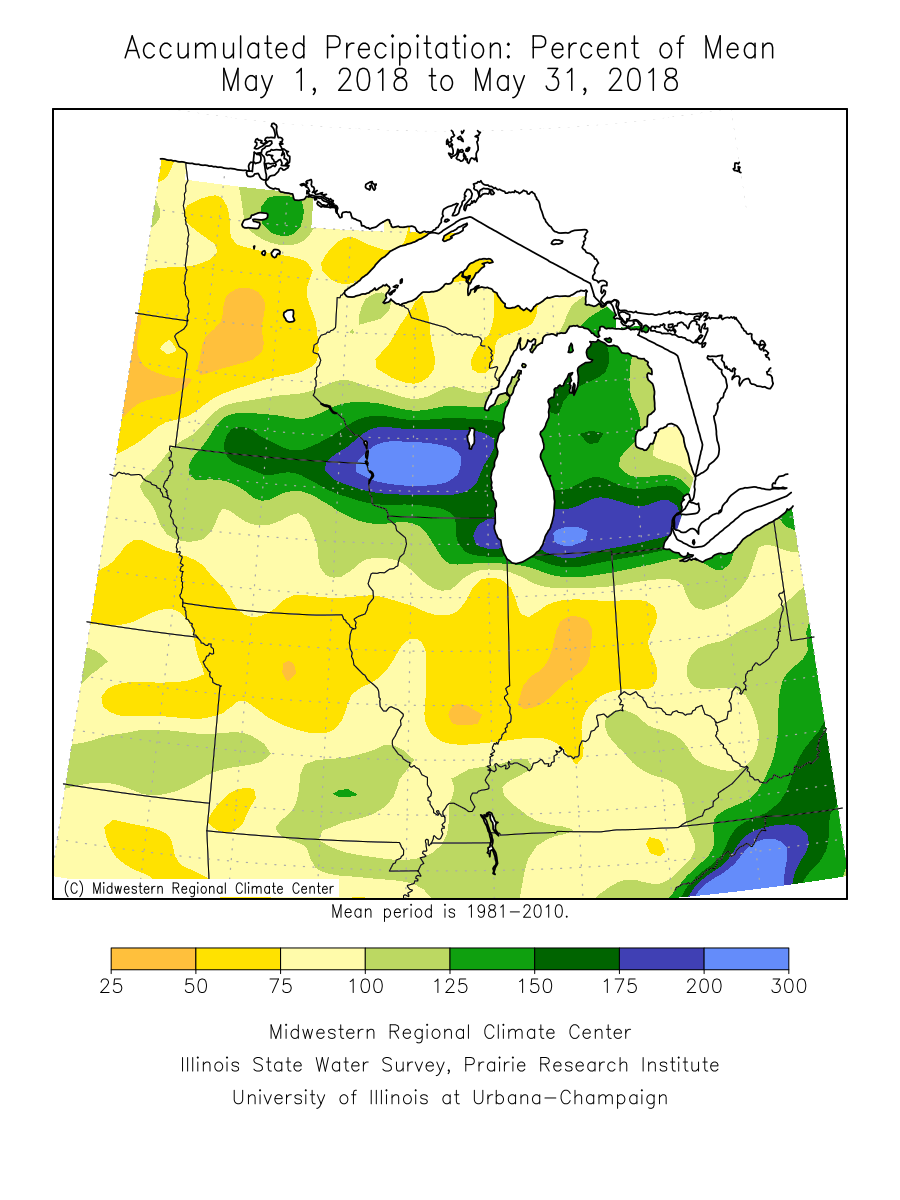
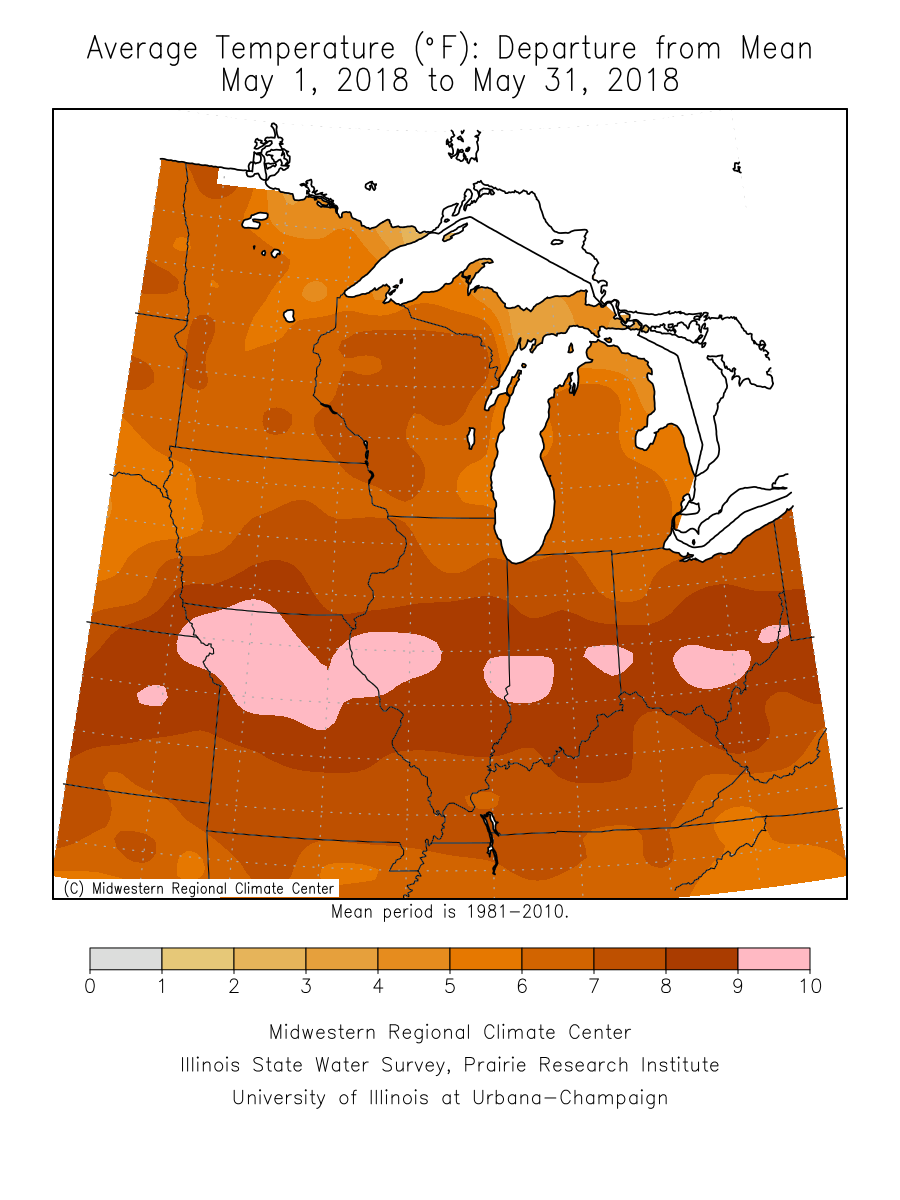
- New month, new weather. May 2018 was the polar opposite of April 2018. After the 3rd coldest April in Minnesota, the preliminary statewide average temperature for May was 60.8 degrees F, for the 4th warmest May in 124 years of records (1895-2018). The preliminary state-averaged precipitation total was 2.70 inches or the 45th driest out of 124 years of records.
[see: May 2018 Precipitation Total Map | May 2018 Precipitation Departure Map | May 2018 Climate Summary Table | May 2018 Percent of Normal Precipitation Map] - The most memorable weather event of May 2018, was the July-like heat wave at the end of the month, topped off with a smattering of high temperatures in the triple digits on Memorial Day. It was the earliest 100-degree temperature reported in the Twin Cities in the era of record keeping since 1871.
[see: Memorial Weekend Heat | 90 Degrees in May] - May finished in the top ten warmest for many locations, including the warmest average May temperature in Duluth with 57.7 degrees or 6.3 degrees above normal. It was the second warmest May in the Twin Cities, and the third warmest at Rochester. Elsewhere it was the sixth warmest in St. Cloud and the eighth warmest at International Falls. Extremes for the month ranged from 102 degrees at Madison and Amboy on Memorial Day (May 28) to 21 degrees at Brimson and Celina on May 11.
[see: Climate At a Glance | St. Cloud Summary from St. Cloud State University | Twin Cities May Rankings | May 2018 Climate Summary Table | 2018 May Departure from Normal Temperature Map] - Seasonal precipitation so far (April 1 through June 5) shows above normal precipitation in the far south, and in the Lake of the Woods area, with near average across the rest of the south and north central. a large area of central Minnesota is below average, with west central Minnesota well below normal and is ranked in the lowest 20 percentile.
[see: Weekly Precipitation Maps
Where we stand now:
- The U. S. Drought Monitor map released on June 5, shows Abnormally Dry conditions over 36% of the state. This is a reduction in coverage from the previous week. The recent rains over the east central and north central Minnesota helped to alleviate dry conditions there. Abnormally Dry conditions persist across northwest and west central Minnesota, as well as parts of the northeast. The U.S. Drought Monitor index is a blend of science and subjectivity where drought categories (Moderate, Severe, etc.) are based on several indicators.
[see: Drought Conditions Overview] - The U.S. Geological Survey reports that stream discharge values are generally normal to above normal across the state, with much above normal streamflows in the east central. There are a few pockets of below normal stream flow, especially in the Boundary Waters Area and the Pigeon River at Grand Portage.
[see: USGS Stream Flow Conditions] - Water levels on most Minnesota lakes vary depending on lake and location in the state. The ice left Mille Lacs Lake on May 11 and the water level has been slightly below the median lake level for May. The lake level on Lake Minnetonka on June 6 was at 929.38 feet with 150 cfs flowing through Gray's Bay Dam. White Bear Lake was 923.37 feet on June 7, a decline of two tenths of a foot from a year ago at this time. The level on June 7 is 4.49 feet higher than the record low of January 10, 2013. The recent high level mark since that low was 923.63 on May 28, 2017. Lake of the Woods is running a bit below the median level for early June. Rainy Lake is within the median band. Lake Superior was at 602.07 feet for early June, two inches above the long term monthly average for June.
[see: Mille Lacs Lake Water Level | Lake Minnetonka Water Level | White Bear Lake Water Level | Lake of the Woods Control Board Basin Data | Corps of Engineers Great Lakes Water Levels] - The Agricultural Statistics Service on June 4 reported that topsoil moisture across Minnesota is 1 percent Very Short, 9 percent Short, 80 percent Adequate, and 10 percent Surplus. Soil moisture readings at Lamberton on June 1 have the moisture profile close to historical averages.
[see: Agricultural Statistics Service Crop Progress and Condition | U. of M. Southwest Research & Outreach Center (Lamberton)] - The potential for wildfires is currently rated by DNR Forestry as Low across all of Minnesota. Historically, 80 percent of all wildfires in Minnesota occur during April and May.
[see: Fire Danger Rating Map] - 2018 was a near-historic late lake ice out in Minnesota. Many larger lakes in central and northern Minnesota did not lose their ice cover until the first week of May. Luckily for anglers, warmer conditions hastened lake ice out just before the 2018 fishing opener. There were some new late lake ice out records set. Most notable was White Bear Lake with May 4 and a tie for the all time late lake ice out at Minnetonka with May 5. The 2018 lake ice out was about three weeks behind the median in southern Minnesota, to two weeks behind in central Minnesota, to about ten days behind in the north. The gap was closed a bit due to some very warm conditions at the end of April and the beginning of May.
[see: Lake Ice Out: 2018 | Table of Lake Ice Out:2018
Future prospects:
- The June precipitation outlook leans towards equal chances for below, above and normal precipitation across Minnesota, except the northwest where there is a slightly higher chance for above normal precipitation. June precipitation normals range from just over three inches in northwest Minnesota to about five inches in southeastern counties.
[see: Climate Prediction Center 30-day Outlook | June Precipitation Normal Map] - According to the Climate Prediction Center, the warm conditions of the end of May will persist though June. Most of the country has a tendency for above normal temperatures in June. The best chance for above normal temperatures in Minnesota is across the central and south. Normal June high temperatures are in the low to mid 70s early in the month, rising to around 80 by month's end. Normal June low temperatures are in the low 50s to start the month, and rise to around 60 as the month ends.
[see: Climate Prediction Center 30-day Outlook | June Temperature Normal Map] - The 90-day precipitation outlook for June through August indicates equal chances of below-normal, near-normal, or above-normal conditions over Minnesota, with a little better chance of above normal precipitation in the southeast. The June through August temperature projection favors equal chances for below-normal, near-normal or above-normal conditions statewide.
[see: Climate Prediction Center 90-day Outlook] - The National Weather Service produces long-range probabilistic river stage and discharge outlooks for the Red River, Minnesota River, and Mississippi River basins. These products address both high flow and low flow probabilities. The major tributaries (St. Croix, Minnesota and Mississippi) are all well below flood stage. Only the Mississippi River at Genoa is just above the "Action" stage level.
[see: National Weather Service - North Central River Forecast Center]
From the author:
- It's been a relatively quiet severe weather season in Minnesota so far. The first tornado of the season was a very weak one on May 25 in Faribault County near Minnesota Lake. There was one inch hail reported in Whitewater State Park on May 25 and some golf ball-sized hail in Waseca and Olmsted Counties on May 29. [see: May 25, 2018 Severe Storms | May 29, 2018 Severe Storms
Upcoming dates of note:
- June 21: National Weather Service releases 30/90 day temperature and precipitation outlooks
![]() Subscribe to email announcements of the monthly posting of this product.
Subscribe to email announcements of the monthly posting of this product.
Pete Boulay, DNR Climatologist