
Ocean near-surface water temperature patterns associated with the strong El Niño episode of 1997-98.
Image credit: NOAA Climate Prediction Center.
Image credit: NOAA Climate Prediction Center.
First, what are El Niño and La Niña?
El Niño is the shorthand name for warmer-than-normal surface and near-surface waters that develop and persist near the equator in the central and eastern Pacific Ocean, generally for periods of nine months or more. This oceanic warming reduces the speed of winds blowing westward across the equator, leading to a large eastward shift in the typical equatorial and tropical thunderstorm activity in the Pacific Ocean. The altered temperature patterns near the surface of the ocean, and resulting changes in the winds in that region, lead to rather substantial changes in many global weather patterns. The additional heat that originates near the equatorial Pacific often ends up distributed far and wide, producing an overall warming effect globally.La Niña is, effectively, the opposite condition: cooler-than-normal waters develop and persist near the equator in the central and eastern Pacific Ocean, with stronger easterly winds producing a westward shift in equatorial and tropical thunderstorm activity. With cooler waters near the equatorial Pacific, La Niña tends to have a cooling effect globally.El Niño and La Niña are part of a repeating cycle (though not always a predictable one) that also includes an important neutral phase in which the ocean temperatures remain near normal. The whole phenomenon of regularly "oscillating" water temperature patterns in this part of the Pacific Ocean is termed the "El Niño Southern Oscillation," or ENSO (pronounced "en-so") for short. From 1950 through September 2023, El Niño conditions occurred just over 25% of the time, comprising 25 distinct seasonal episodes, each covering the winter season at least (it will be 26 once the 2023 episode becomes official). (For a much deeper look at ENSO, we recommend the this essay and NOAA's ENSO Blog.)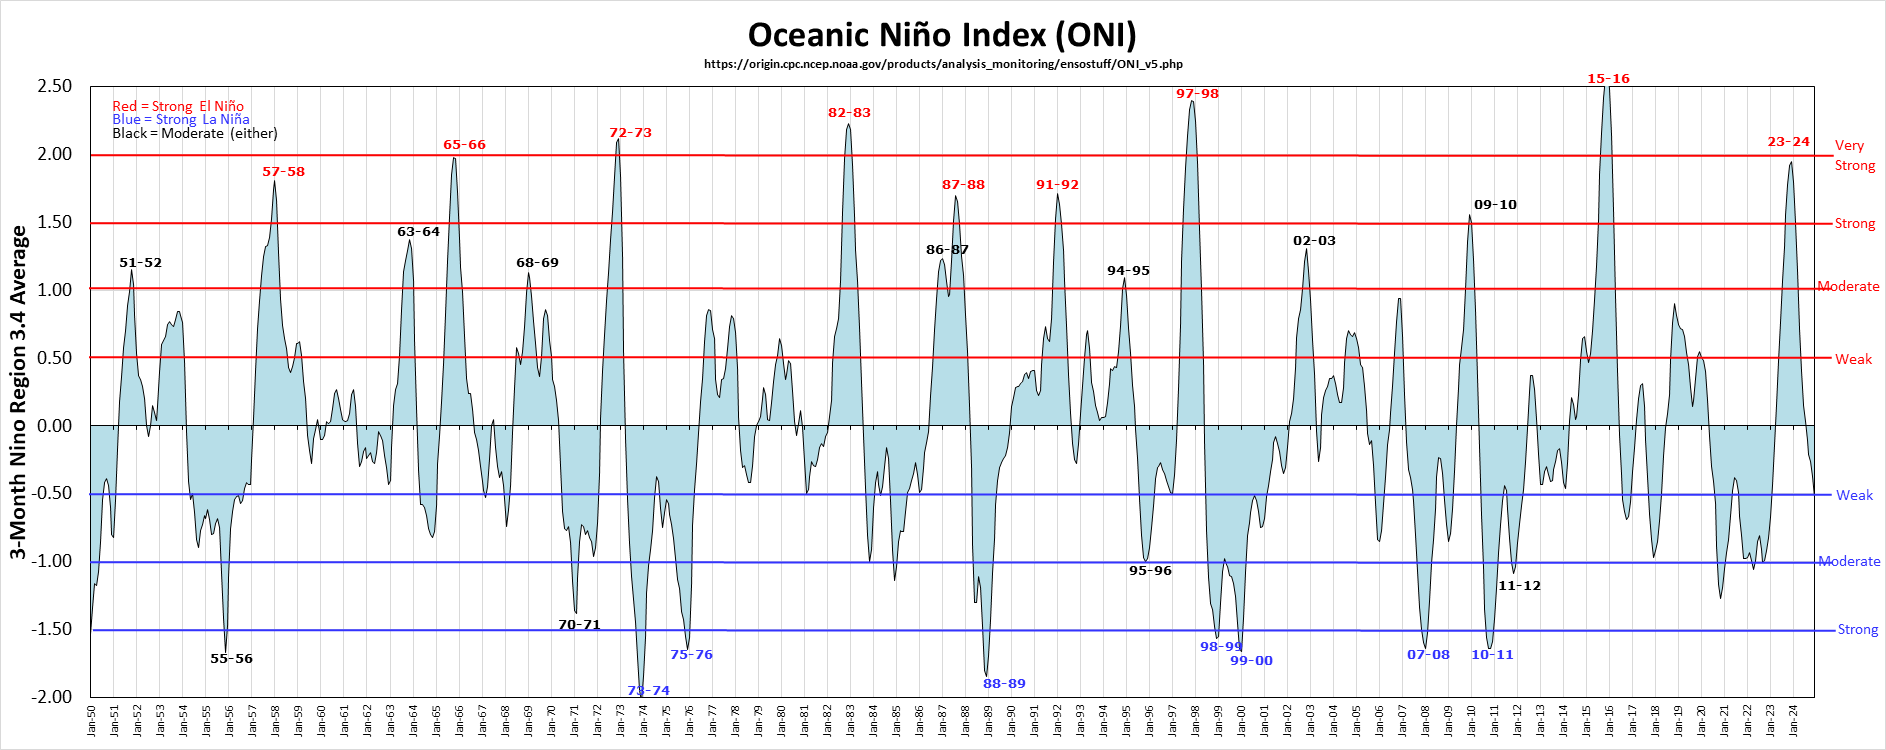
El Niño and La Niña episodes since 1950
Courtesy: Golden Gate Weather
Courtesy: Golden Gate Weather
El Niño Development and Intensity
El Niño tends to develop and intensify during summer or fall and last into early spring. It can develop much earlier in the year, or persist longer, and the record contains instances of back-to-back episodes and continuous El Niño conditions that span parts of three years. An El Niño becomes official when ocean temperatures in the "Niño 3.4 region" remain at least 0.5 degrees C (0.9 F) above recent 30-year averages for five consecutive three-month periods. An episode is identified as "moderate" if any three-month period is at least 1.0 C (1.8 F) above average, and "strong" if it reaches 1.5 degrees C (2.7 F) above average. NOAA's Climate Prediction Center calls an episode "historically strong" (others use the term "very strong") if the Niño 3.4 region reaches 2.0 C (3.6 F) above average. Of the 25 El Niño episodes since 1950, six have been moderate, four have been strong, and five have been very strong or historically strong. The most recent very strong episode was in 2015-16, which is considered to be the strongest El Niño on record.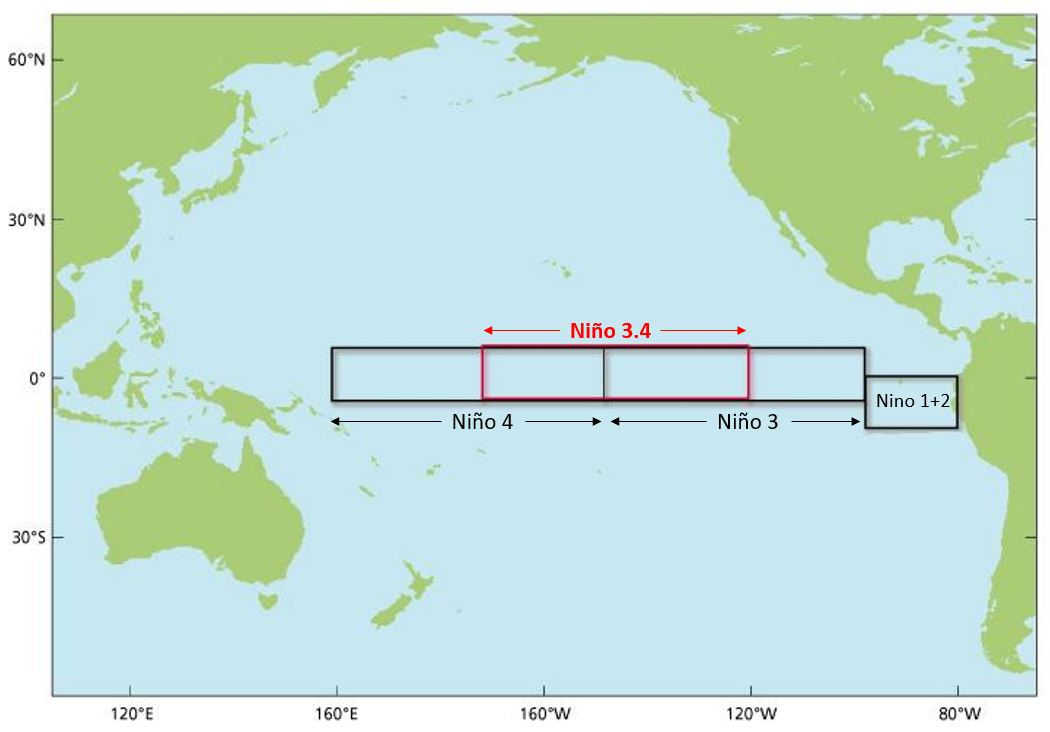
El Niño and Minnesota's Weather
El Niño has a reputation as a global climate phenomenon, because it can change the paths and locations of important atmospheric wind patterns, further influencing how weather systems behave and move. The western coasts of Peru and Ecuador, and parts of the southern US, have at times experienced destructively wet conditions during El Niño episodes. Other areas, however, can become much drier than usual. Hurricane and tropical cyclone forecasters often expect less Atlantic activity during El Niño events. Not all areas are affected noticeably by El Niño, but those that are usually see the main effects between fall and spring (spring and fall in the southern hemisphere).In Minnesota, El Niño conditions have tended to produce mild winters with less snow than average. The 25 El Niño winters since 1950 averaged 1.8 degrees F warmer on a statewide basis than non-El Niño winters, and have produced an average of 22% less snow (12.7 inches) in the Twin Cities. The warmest December-through-February on record in Minnesota came during the very strong 1997-98 El Niño episode. The very strong events in 2015-16 and 1982-83; the strong El Niño in 1991-92; and the moderate one in 1986-87, also are associated with winters that are among Minnesota's 10 warmest on record. There are, of course, notable exceptions. The Halloween Blizzard of 1991 occurred during a strong El Niño event, and was followed by other heavy snowstorms during November, making it the snowiest month on record at many locations. Mild and uneventful conditions did set in during the rest of winter. In 1982-83, during a very strong El Niño, a mild and wet winter was punctuated by two outstanding blizzards--one in late December and one in mid-April. More recently, the weak El Niño of 2018-19 began with a warm "snow drought" that lasted through mid-January, but then gave way to an incredible winter barrage that included extreme cold and almost endless accumulating snow, which led to spring flooding across the state. The moral of the story is that El Niño tends to yield mild and low-snow winters, but extremely cold and extremely snowy exceptions are always just an Arctic cold front away in Minnesota!Below are some basic statistics summarizing winter conditions in Minnesota and the Twin Cities during El Niño and non-El Niño years. The transition into and out of El Niño and its overall timing also appear to influence Minnesota's weather. Additionally, El Niño appears to have some interesting associations with the weather in the other seasons as well. We will address these topics in a separate post.| Condition | Count(1950-51 to 2022-23) | Minnesota AvgWinter Temp (F) | Minnesota AvgWinter Precipitation (in.) | Twin Cities AverageSeasonal Snowfall (in.) |
|---|---|---|---|---|
| Weak El Niño | 10 | 10.8 | 2.39 | 42.6 |
| Moderate El Niño | 6 | 13.7 | 2.27 | 43 |
| Strong El Niño | 4 | 13.9 | 2.03 | 47.1 |
| Very Strong El Niño | 5 | 16.0 | 2.64 | 46.8 |
| All El Niño (average) | 25 | 13 | 2.35 | 44.3 |
| Non-El Niño | 47 | 11.2 | 2.47 | 57.0 |
Last modified: February 21, 2024
For more information contact: [email protected]