


Image credit: NOAA Climate Prediction Center.
As 2026 has worn on, Minnesotans have begun hearing a lot about a likely "Super" El Niño developing this fall and winter, and potentially becoming the strongest El Niño on record.
What is El Niño and why would a "super" one, or one that breaks global records matter? This article is intended to help readers understand this important global climate pattern, and what it has meant for Minnesota historically. This story updates the version shared before the 2023-24 El Niño.
First, what are El Niño and La Niña?
El Niño is the shorthand name for a persistent warming of surface and near-surface waters near the equator in the central and eastern Pacific Ocean, eventually becoming "coupled" with the atmosphere in a manner that can alter seasonal weather patterns dramatically. The pattern usually emerges during summer, intensifies during fall, peaks in November or December, and persists several months after its peak.
This warming of the equatorial Pacific ocean reduces the speed of winds blowing westward across the equator, leading to a large eastward shift in the typical equatorial and tropical thunderstorm activity in the Pacific Ocean. The altered temperature patterns near the surface of the ocean, and resulting changes in the winds in that region, lead to rather substantial changes in many global weather patterns, affecting the position, movement, and intensity of jet streams, for example. The additional heat that originates near the equatorial Pacific often ends up distributed far and wide, producing an overall warming effect globally.
La Niña is, effectively, the opposite condition: cooler-than-normal waters develop and persist near the equator in the central and eastern Pacific Ocean, with stronger easterly winds producing a westward shift in equatorial and tropical thunderstorm activity. With cooler waters near the equatorial Pacific, La Niña tends to have a cooling effect globally.
El Niño and La Niña are part of a repeating cycle (though not always a predictable one) that also includes an important neutral phase in which the equatorial Pacific Ocean temperatures remain near normal. The whole phenomenon of regularly "oscillating" water temperature patterns in this part of the Pacific Ocean is termed the "El Niño Southern Oscillation," or ENSO (pronounced "en-so") for short. From 1950 through July 2026, El Niño conditions occurred about 34% of the time, comprising 27 distinct seasonal episodes, each covering the winter season at least (it will be 28 once the 2026-27 episode becomes official).
(For a much deeper look at ENSO, we recommend the this essay and NOAA's ENSO Blog.)
Courtesy: Golden Gate Weather
El Niño Development and Intensity
El Niño tends to develop and intensify during summer or fall and last into early spring. It can develop much earlier in the year, or persist longer, and the record contains instances of back-to-back episodes and continuous El Niño conditions that span parts of three years.
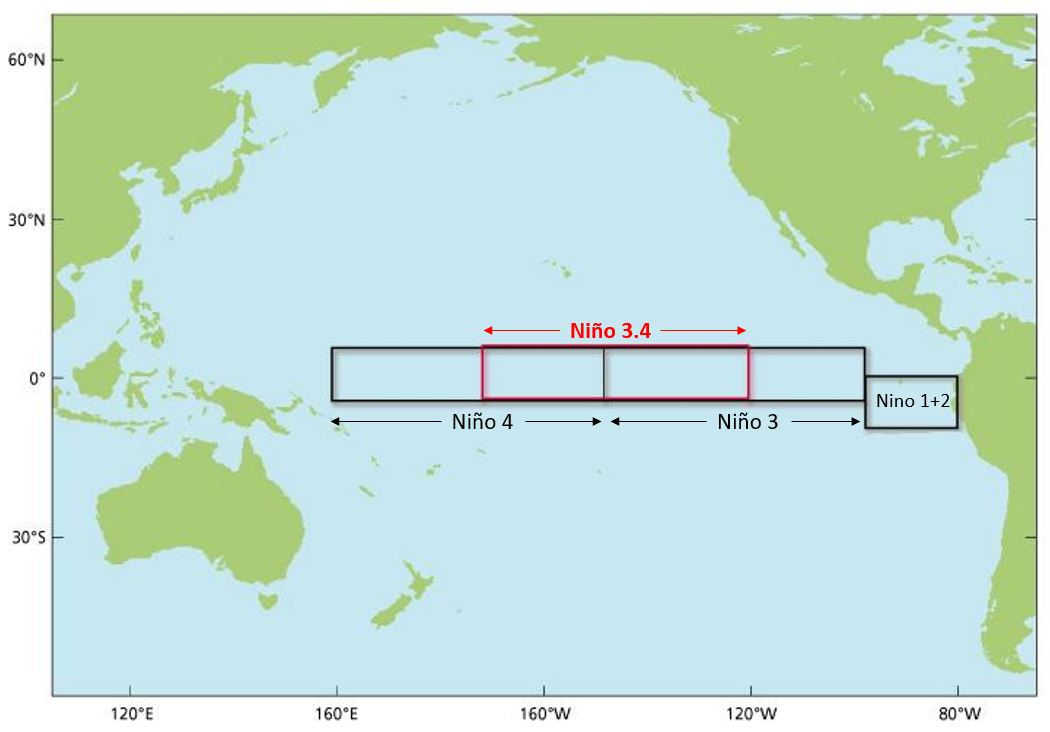
An El Niño becomes official when ocean temperatures in the "Niño 3.4 region" remain at least 0.5 degrees C (0.9 F) above recent 30-year averages for five consecutive three-month periods. An episode is identified as "moderate" if any three-month period is at least 1.0 C (1.8 F) above average, and "strong" if it reaches 1.5 degrees C (2.7 F) above average. NOAA's Climate Prediction Center calls an episode "historically strong" (others use the terms "very strong" or "super") if the Niño 3.4 region is at least 2.0 C (3.6 F) above average.
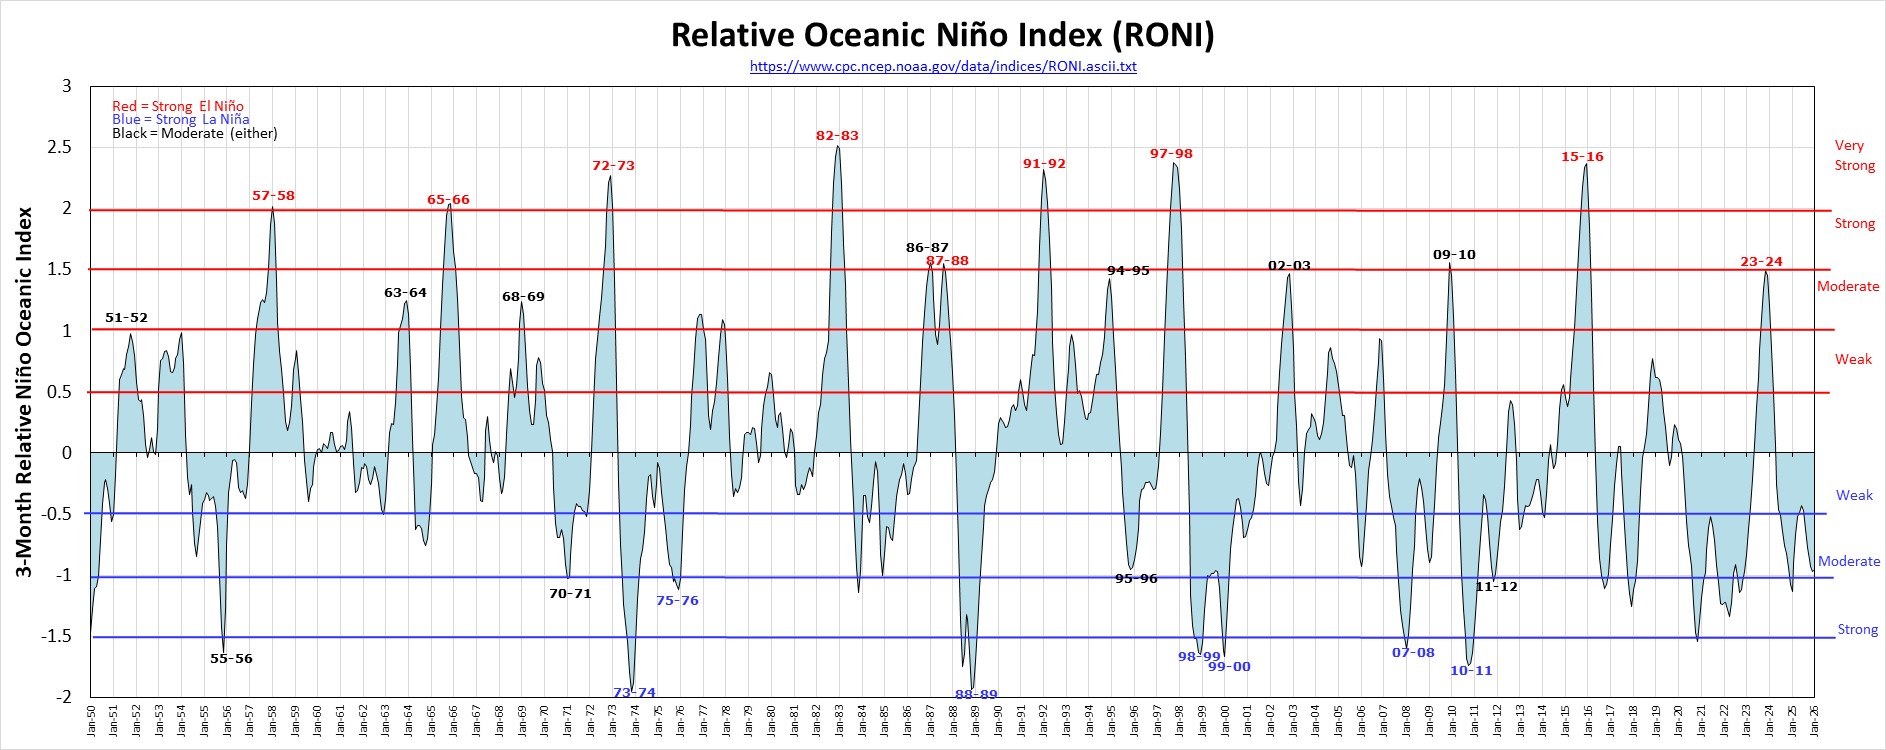
Of the 27 El Niño episodes since 1950, six have been moderate, three have been strong, and six have been very strong or historically strong ("super") events. The most recent very strong episode was in 2015-16. The major event in 1982-83 is considered to be the strongest El Niño on record. As of late September 2026, the temperature of the Niño 3.4 region is the highest ever measured, and official forecasts from numerous agencies indicate a high likelihood this episode will become the strongest El Niño on record.
El Niño has a reputation as a global climate phenomenon because it can change the paths and locations of important atmospheric wind patterns, further influencing the behavior and movement of heat, moisture, and weather systems. The western coasts of Peru and Ecuador, and parts of the southern US, have at times experienced destructively wet conditions during El Niño episodes. Other areas, however, can become much drier than usual. Tropical cyclone forecasters often expect more Pacific Ocean but less Atlantic Ocean hurricane activity during El Niño events. Not all areas are affected noticeably by El Niño, but those that are usually see the main effects between fall and spring (spring and fall in the southern hemisphere).
El Niño and Minnesota's Weather
In Minnesota, El Niño conditions have tended to produce mild winters with less snow than average. In fact The 27 El Niño winters since 1950 averaged 2.4 degrees F warmer on a statewide basis than non-El Niño winters, and have produced an average of 24% less snow (13.7 inches) in the Twin Cities. By far the warmest December, and the warmest December-through-February on record in Minnesota, came during the moderate 2023-24 El Niño episode*. The very strong events in1982-83, 1991-92, 1997-98, and 2015-16, and the strong one in1986-87, also are associated with winters that stand among Minnesota's 10 warmest on record.
Intense winter weather can occur during even major El Niño events. The Halloween Blizzard of 1991 occurred during a very strong El Niño, and was followed by other heavy snowstorms during November, making it the snowiest month on record at many locations. Mild and uneventful conditions did set in during the rest of winter. In 1982-83, the El Niño of record, a mild and wet winter was punctuated by two outstanding blizzards--one in late December and one in mid-April. More recently, the weak El Niño of 2018-19 began with a warm "snow drought" that lasted through mid-January, but then gave way to an incredible winter barrage that included extreme cold and almost endless accumulating snow, which led to spring flooding across the state. The moral of the story is that El Niño tends to yield mild and low-snow winters, but extremely cold and extremely snowy exceptions are always just an Arctic cold front away in Minnesota!
Moreover, given the reasonable potential for an unprecedented El Niño event in 2026-27, the observed and recorded past may not fully encapsulate what different regions around the world can anticipate. In Minnesota, where a mild winter is forecast by the NOAA Climate Prediction Center, the degree of warmth we experience will be influenced by how much snow is on the ground during winter. Deep snows from large storms can blunt the intensity of the warm surges by reflecting away sunlight and limiting the ground's ability to warm up and radiate heat. Conversely, bare ground absorbs sunlight readily, heating the air above it. Winter days with bare ground are 4-8 degrees F warmer than days with just less than four inches of snow cover, 8-12 degrees warmer than days with less than 10 inches of snow cover. Winters with persistent, deep frequent bare ground tend to be much warmer than winters with persistent, deep snow cover.
Below are some basic statistics summarizing winter conditions in Minnesota and the Twin Cities during El Niño and non-El Niño years. The transition into and out of El Niño and its overall timing also appear to influence Minnesota's weather. The spring and summer following El Niño events, particularly moderate or stronger, has shown a tendency to be "active," with highly heavy thunderstorms producing an abundance of severe weather and/or rainfall.
*The Climate Prediction Center recently changed the classification scheme it uses to assess the strength of El Niño (and La Niña) events, to account for the ongoing warming of the Pacific Ocean over time. The older index tended to inflate the intensity of more recent episodes while slightly muting historical ones. The newer index attempts to "normalize" the ongoing changes, so that each event is rated relative to what's normal at its time. Thus, the 2023-24 event had appeared to be "very strong" according the old index, but is now technically at the upper end of "moderate" using the new index.
Winter temperature, precipitation, and snowfall characteristics during El Niño and non- El Niño winters in Minnesota
Condition | Count (1950-51 to 2025-26) | Minnesota Avg Winter Temp (F) | Minnesota Avg Winter Precipitation (in.) | Twin Cities Average Seasonal Snowfall (in.) |
|---|---|---|---|---|
| Weak El Niño | 8 | 12.4 | 2.43 | 39.0 |
| Moderate El Niño | 10 | 11.9 | 2.40 | 45.4 |
| Strong and Very Strong ("Super") El Niño | 9 | 16.2 | 2.28 | 44.1 |
| All El Niño | 27 | 13.5 | 2.37 | 43.1 |
| Non-El Niño | 49 | 11.1 | 2.47 | 56.8 |
Last modified: September 29, 2026
KAB