A monthly electronic newsletter summarizing Minnesota's climate conditions and the resulting impact on water resources. Distributed on the first Thursday of the month.
State Climatology Office - DNR Division of Ecological and Water Resources, St. Paul
distributed: November 3, 2017
What happened in October 2017:
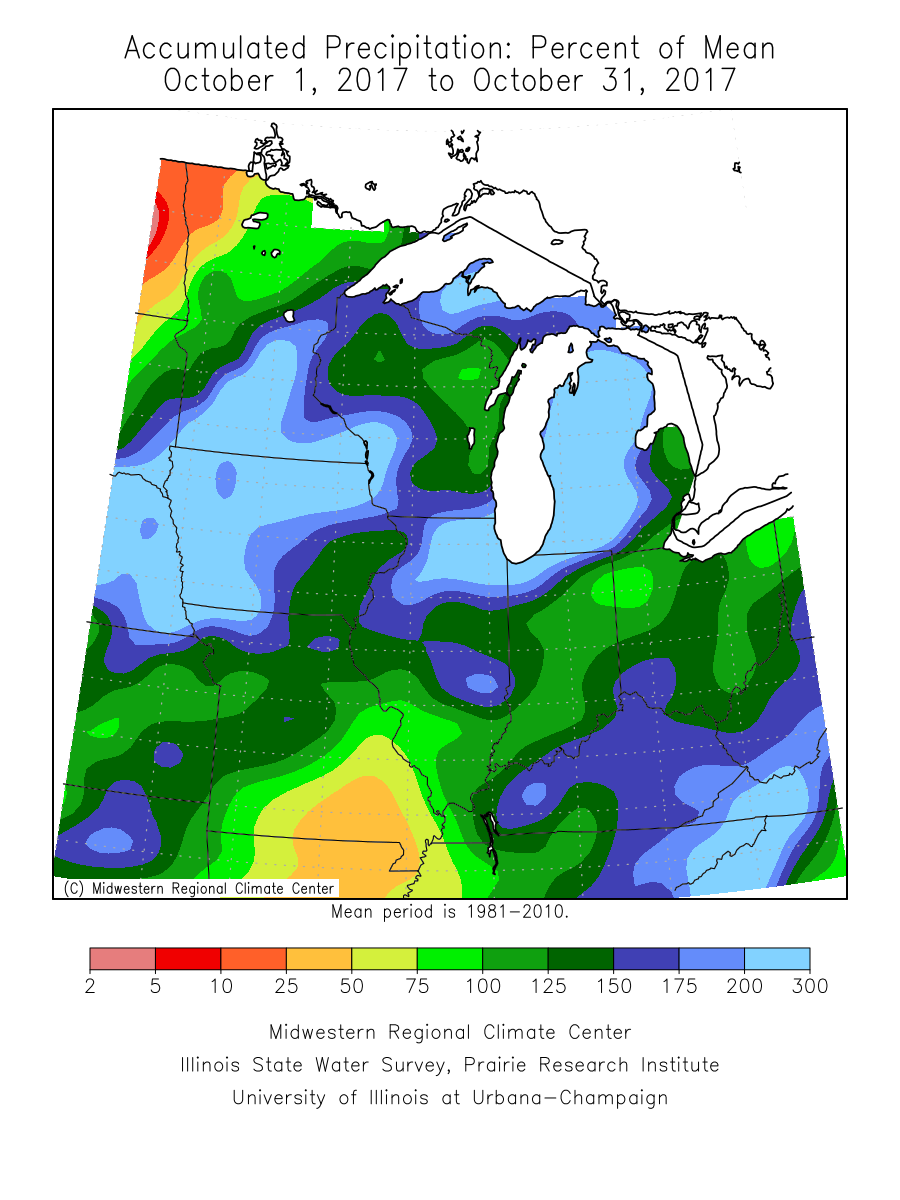
- October lived up to its name as a transition month with summer-like weather hanging on at the start and a good taste of winter for the end of the month. The preliminary statewide precipitation total was 3.98 inches or 1.57 inches above normal. The heaviest precipitation fell in two areas. One was a swath of five to seven inches for the month from southwest to east central Minnesota. These areas finished about two to four inches above normal. Parts of the far southeast also saw monthly totals well above normal. Northwest and north central Minnesota ranged from about one half to an inch below normal. One of the direst locations was Ada in northwest Minnesota with .77 inches or a departure of 1.47 inches. The wettest location was Caledonia in southeast Minnesota with a a total of 7.76 inches or a surplus of 5.26 inches. For the last week in the month, precipitation fell in the solid form with a fairly sizable snow pack for October forming in the northeast by Halloween.
[see: October 2017 Precipitation Total Map | October 2017 Precipitation Departure Map | October 2017 Climate Summary Table | October 2017 Percent of Normal Precipitation Map]
Some notable events include: - October 2017 had two heavy rain episodes. One was on October 2-3 from southwest to northeast Minnesota and another event in southeast Minnesota on October 6-7. The former event impacted much of Minnesota and rainfall totals were in the one to three inch range. The highest rainfall total found so far was 4.80 inches near Maple Lake in Wright County. This rainfall elevated stream flow with a few streams reaching minor flood stage.
[see: Heavy Rains: October 2-3, 2017] - The next heavy rain event affected southeast Minnesota, with Spring Grove seeing some of the heaviest rain with 3.37 inches.
- The final week of October turned wintry, with many locations in Minnesota seeing some snowflakes. Around the Twin Cities, there was enough accumulation to whiten the ground. farther north, the snow was heavier with significant accumulation away from Lake Superior on the North Shore. 10.3 inches fell near Finland in Lake County. Ely saw 7.1 inches. Large waves from Lake Superior damaged the lakewalk in Canal Park.
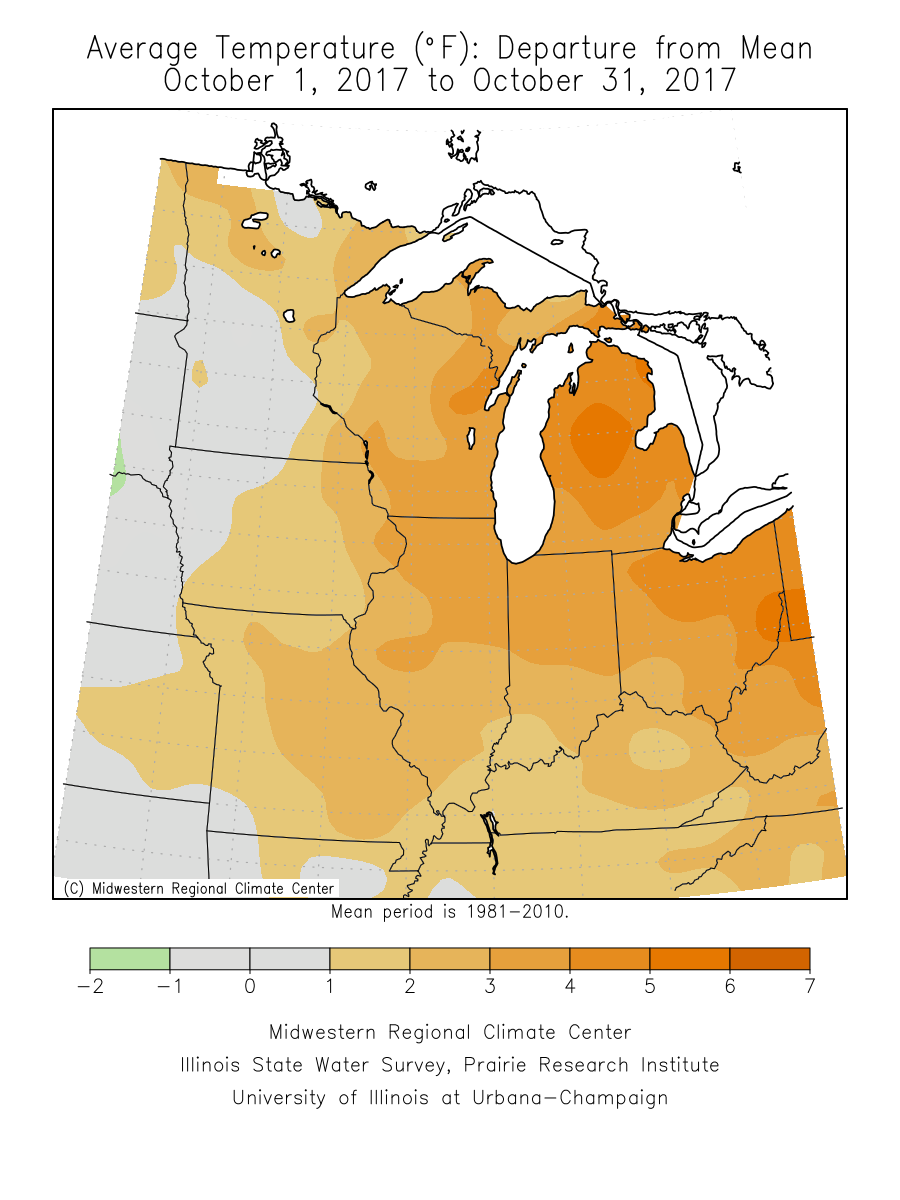
[see: October 27-28 Storm.] - Despite the cool finish, October 2017 was warmer than normal for the month. The preliminary statewide average for October 2017 was 48.2 degrees or 2.2 degrees above normal. The warmest temperature for the month was 81 degrees at Granite Falls and Montevideo in southwest Minnesota on October 20. The coldest was at Browns Valley in west central Minnesota on October 29.
[see: October 2017 Climate Summary Table | 2017 October Departure from Normal Temperature Map]
Where we stand now:
- Seasonal precipitation totals (April 1 through October 31) ranked above the historical median over most of the southeast 2/3rd of Minnesota, with much of central Minnesota in the 85% ranking for the wettest growing season. Some areas are in the 98th percentile or nearly the wettest on record. Areas in north central and northwest Minnesota fall short of the median, with a few areas ranked in the lowest 15 percentile.
[see: Seasonal Precipitation Ranking Map] - Winter arrived early in northern and central Minnesota. Snow depths range from one to six inches across large sections of north central and northeast Minnesota. Snow depths range from eight to ten inches along the Lake Superior highlands.
[see: NWS Snow Depth Estimation Map | Midwest Regional Climate Center Snow Depth Map] - The U. S. Drought Monitor map released on October 31, depicts a small area of north central Minnesota in the Moderate Drought category. Less than two percent of the state is in the Moderate Drought category, This is quite a bit of a reduction from August 1. Around nine percent of the state is Abnormally Dry. Last year at this time there was no drought designation in Minnesota. The U.S. Drought Monitor index is a blend of science and subjectivity where drought categories (Moderate, Severe, etc.) are based on several indicators.
[see: Drought Conditions Overview] - The U.S. Geological Survey reports that stream discharge values are above to much above normal across large sections of central and southern Minnesota. Normal to above normal flows are in the southeast and northeast with some below normal stream flows in north central and northwest Minnesota.
[see: USGS Stream Flow Conditions] - Water levels on most Minnesota lakes vary depending on lake and location in the state. Mille Lacs was above the median lake level for early November. On November 3, Minnetonka was at 928.65 feet with 20 cfs flowing through Grays Bay Dam. White Bear Lake was at 922.96 feet on November 3, a rise of .34 feet from one year ago and a decline of .67 feet from the 2017 high mark of 932.63 feet. Rainy and Lake of the Woods are in the median range for September. Lake Superior was at 602.95 feet on November 3, six inches higher than the monthly average for early November.
[see: Mille Lacs Lake Water Level | Lake Minnetonka Water Level | White Bear Lake Water Level | Lake of the Woods Control Board Basin Data | Corps of Engineers Great Lakes Water Levels] - The Agricultural Statistics Service on October 30 reports that topsoil moisture across Minnesota is 0 percent Very Short, 6 percent Short, 78 percent Adequate, and 16 percent Surplus. Soil moisture levels at Lamberton and Waseca are above the historical median.
[see: Agricultural Statistics Service Crop Progress and Condition | U. of M. Southwest Research and Outreach Center (Lamberton) | U. of M. Southern Research and Outreach Center (Waseca)] - The potential for wildfires is currently rated by DNR Forestry as Low across Minnesota. Historically, 80 percent of all wildfires in Minnesota occur during April and May.
[see: Fire Danger Rating Map]
Future prospects:
- The November precipitation outlook leans towards normal precipitation in southwest Minnesota, with above normal precipitation across the rest of the state. November precipitation normals range from about three-quarters of an inch in northwest Minnesota to about two-and-a-half inches in Cook County. Southern and central Minnesota range by about one-and-a-quarter of an inch in the southwest to about two-inches_and a quarter in south central Minnesota.
[see: Climate Prediction Center 30-day Outlook | November Precipitation Normal Map] - The November temperature outlook has a tendency for below normal temperatures throughout Minnesota, with the best chance in the west. Normal November high temperatures are in the 40s to start the month, dropping to the 30s by month's end. Normal lows are in the 30s to upper 20s early in the month, falling to the teens by late November.
[see: Climate Prediction Center 30-day Outlook | November Temperature Normal Map] - The 90-day temperature outlook for November through January has equal chances of below-normal, near-normal, or above-normal conditions across western Minnesota, with a tendency for above normal temperatures over eastern Minnesota. The 90-day precipitation outlook for October through December also indicates equal chances of below-normal, near-normal, or above-normal conditions across most of Minnesota.
[see: Climate Prediction Center 90-day Outlook] - The National Weather Service produces long-range probabilistic river stage and discharge outlooks for the Red River, Minnesota River, and Mississippi River basins. These products address both high flow and low flow probabilities.
[see: National Weather Service - North Central River Forecast Center]
From the author:
- The Winter Outlook (December-February) From the Climate Prediction Center has a tendency for below normal temperatures. There is a slight tendency for above normal precipitation for all but southwest Minnesota. There is a 55-65 percent chance of a weak La Nina this winter. Note that there was a similar outlook for la Nina last November and the statewide December-February average temperature for the winter of 2016-17 wound up being 8.6 degrees above normal or the sixth warmest on record.
[see: Climate Prediction Center December-February Outlook]
Upcoming dates of note:
- November 16: National Weather Service releases 30/90 day temperature and precipitation outlooks
![]() Subscribe to email announcements of the monthly posting of this product.
Subscribe to email announcements of the monthly posting of this product.
Pete Boulay, DNR Climatologist