A monthly electronic newsletter summarizing Minnesota's climate conditions and the resulting impact on water resources.
State Climatology Office - DNR Division of Ecological and Water Resources, St. Paul
distributed: August 9, 2021
What happened in July 2021:
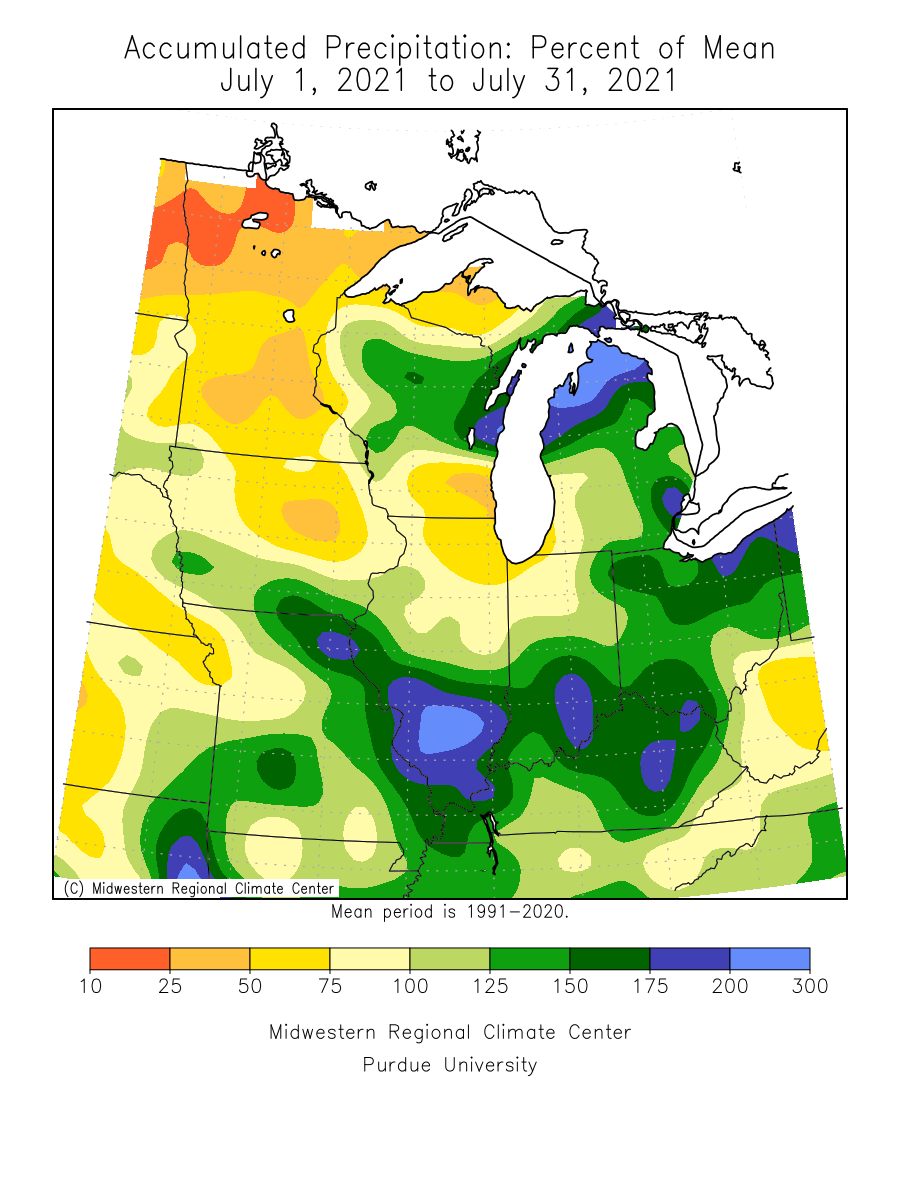
- The dry summer intensified in July 2021. Nearly the entire state finished with below normal precipitation. Most areas in the state were one to three inches short of normal. Some of the driest departures from normal were in central Minnesota. Parts of southeast Minnesota wound up being above normal, mostly along the Mississippi River. The highest July 2021 precipitation total from a National Weather Service Cooperative Observer was 6.22 inches near Hokah in Houston County. This was 1.93 inches above normal. One of the driest locations was Crookston in Polk County with only .32 or 2.78 inches below normal.
[see: July 2021 Precipitation Total Map | July 2021 Precipitation Departure Map | July 2021 Climate Summary Table | July 2021 Percent of Normal Precipitation Map]
There were two notable storm events in July. The first was on July 6-7. The heaviest rains were in two west to east areas, from Long Prairie to Moose Lake and in southern Minnesota from Windom though Winona. There were large areas of one half to an inch and a half of rain, with pockets of two inches or more. One of the heaviest rainfalls found so far was 2.63 inches at Wells in Faribault County.
[see: Beneficial Rains: July 6-7, 2021] - The next significant storm event was on July 26. Strong thunderstorms produced tornadoes, reports of very large hail, and wind damage across portions of northern Minnesota on Monday July 26, 2021. The Grand Forks National Weather Service office confirmed three separate tornadoes: an EF-1 with estimated peak winds of 95 mph that moved southeastward off of Lower Red Lake and passed through the Red Lake community; another EF-1 with estimated peak winds of 95 mph, several miles to the east, just east of Redby; and an EF-0 with estimated 80 mph winds to the south, near Nebish.
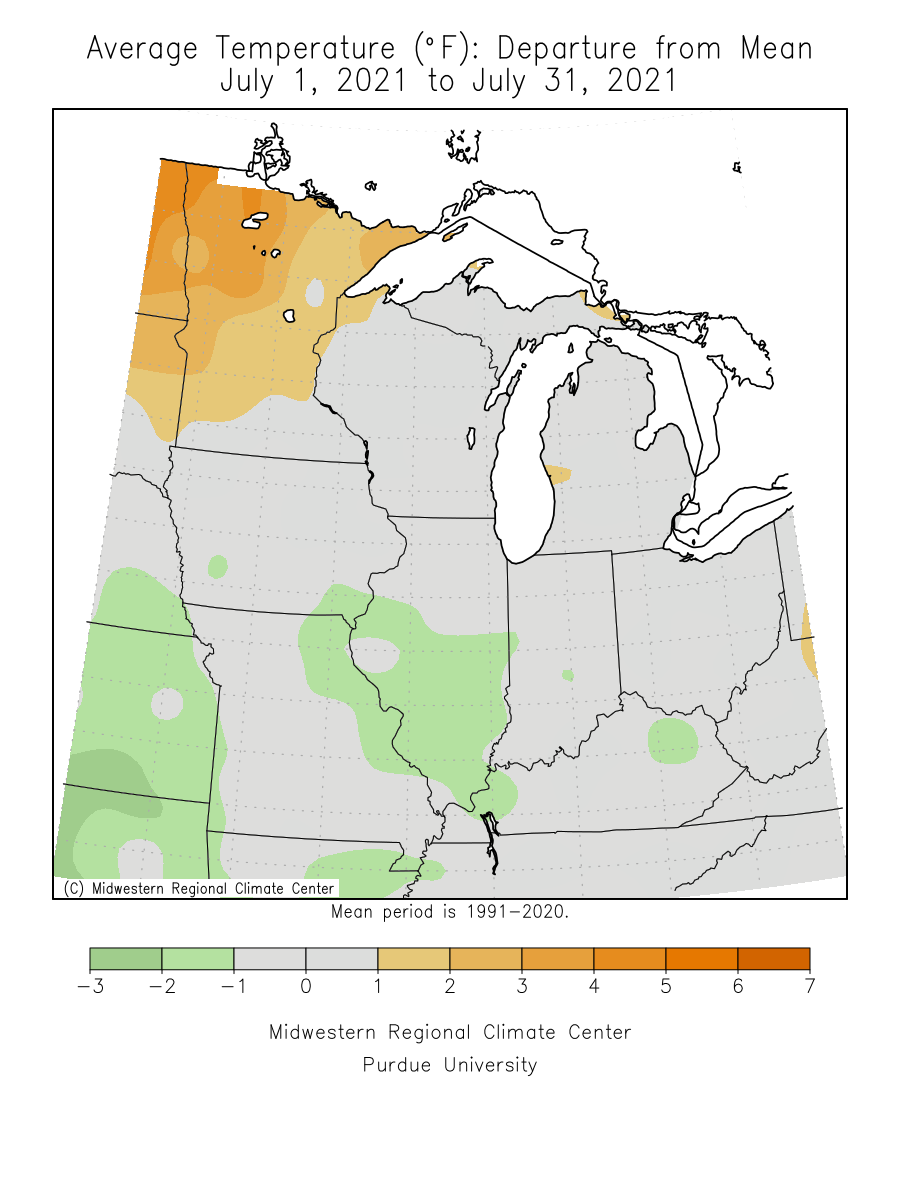
[see: Northern Minnesota Severe Thunderstorms, July 26, 2021] - The preliminary statewide average temperature for July 2021 was 71.3 degrees or 1.4 degrees above normal. This was close to the average temperature for July 2020. The difference is that July 2021 was much drier. The warmest temperature reported in Minnesota for July 2021 was 102 degrees reported at Granite Falls in southwest Minnesota on July 4 and the coldest temperature of the month was 33 degrees at Babbitt and Embarrass on July 8.
[see: July 2021 Climate Summary Table | 2021 July Departure from Normal Temperature Map]
Where we stand now:
- Seasonal precipitation so far (April 1 through August 3) shows that the entire state is short of normal precipitation. Most of the state is in the lowest 10th percentile. Areas where the drought is the worst are in the 2nd percentile, a nearly 1 in 50 year occurrence. Parts of far southeast Minnesota are near the median.
[see: Seasonal Precipitation Maps] - The U. S. Drought Monitor map released on August 5 depicts 2% of the state in the Abnormally Dry category, 19% in the Moderate Drought category, 44% in the Severe Drought category, 35% in the Extreme Drought category. The U.S. Drought Monitor index is a blend of science and subjectivity where drought categories (Moderate, Severe, etc.) are based on several indicators.
[see: Drought Conditions Overview] - The U.S. Geological Survey reports that stream discharge levels to be below normal to much below normal across the central and north, with generally below normal stream flows in the south. A few locations in southern Minnesota have near normal stream flows. The South Fork Root River near Houson on August 9 had much above normal conditions. Some locations in the central and north have low flow conditions, levels that are in the 1 percentile.
[see: USGS Stream Flow Conditions] - Water levels on Minnesota lakes vary depending on lake and location in the state. Mille Lacs was about seven tenths of a foot below the 25 year median for early August. On August 9, Minnetonka was at 928.40 feet, .41 feet lower than this time last year. Gray's Bay Dam closed on July 21. On August 9, White Bear Lake was at 923.80 feet, nearly a foot lower than last year. Rainy Lake was well below the normal band for lake level. Lake of the Woods was well below the median level for early August and was near the 10th percentile. Lake Superior was forecasted to be at 602.23 feet on August 6, one inch above the early August average and 12 inches below the record August level set in 2019. The lake level in Superior is forecast to stay unchanged over the next month.
[see: Mille Lacs Lake Water Level | Lake Minnetonka Water Level | White Bear Lake Water Level | Lake of the Woods Control Board Basin Data | Corps of Engineers Great Lakes Water Levels] - The Agricultural Statistics Service on August 8 reports that topsoil moisture across Minnesota is 39 percent Very Short, 41 percent Short, 19 percent Adequate, and 1 percent Surplus. Available soil water at Lamberton on August 1 was only 1.28 inches, about three inches below the historical average. This was the lowest soil moisture seen since the drought of 2012.
[see: Agricultural Statistics Service Crop Progress and Condition | U. of M. Southwest Research & Outreach Center (Lamberton)] - The potential for wildfires rated by DNR Forestry on August 9, as Low across southern and east central Minnesota. Moderate potential exists over central and parts of northeast Minnesota, with High potential over the west central and the north central. With Very High potential over the northwest. Historically, 80 percent of all wildfires in Minnesota occur during April and May.
[see: Fire Danger Rating Map]
Future prospects:
- The August precipitation outlook has equal chances for above, normal and below normal precipitation in the north east and the southeast parts of the state. The rest of the state has a tendency for below normal precipitation, especially in the northwest. August precipitation normals range from about two-and-a-half inches in northwest Minnesota to about five inches in southeastern counties. The August temperature outlook has a strong tendency for above normal temperatures. Normal August high temperatures are around 80 degrees to start the month, dropping to the mid-70s by month's end. Normal lows are around 60 degrees early in the month, falling to the mid-50s by late August.
[see: Climate Prediction Center 30-day Outlook | August Temperature Normal Map] - The 90-day precipitation outlook for August through October indicates a tendency for below normal precipitation across the state. The August through October temperature projection also has a tendency for above normal temperatures across the northern plains, including Minnesota.
[see: Climate Prediction Center 90-day Outlook] - The National Weather Service produces long-range probabilistic river stage and discharge outlooks for the Red River, Minnesota River, and Mississippi River basins. These products address both high flow and low flow probabilities.
[see: National Weather Service - North Central River Forecast Center]
From the author:
- For the first time in a number of weeks, significant precipitation fell across parts of southern and central Minnesota from August 6-8. The coverage was spotty with some areas seeing 2+ inches of rain, with other areas nearby picking up half that or less. The heaviest rain fell in southeast Minnesota with La Crosse, just across the border from Minnesota seeing 8.44 inches for the three-day period. Another swath of heavier rain with one to three inches fell in an area from southern Lac qui Parle County through western Sibley County. ! [see: Climate Prediction Center Dec 20-Feb 21]
Upcoming dates of note:
- August 19: National Weather Service releases 30/90 day temperature and precipitation outlooks
![]() Subscribe to email announcements of the monthly posting of this product.
Subscribe to email announcements of the monthly posting of this product.