A monthly electronic newsletter summarizing Minnesota's climate conditions and the resulting impact on water resources. Distributed on the first Thursday of the month.
State Climatology Office - DNR Division of Ecological and Water Resources, St. Paul
distributed: June 5, 2025
What happened in May 2025:
- Had it not been for a wet spell from May 19-21, May 2025 would have wound up very dry statewide. For the month as a whole, more places finished below normal for precipitation than above with the overall preliminary average statewide precipitation being 2.73 inches or 1.04 inches short of normal, or about three inches drier than in 2024. One of the highest precipitation totals found so far was 6.03 inches or 1.70 inches above normal at Hastings. One of the driest locations was near Northome in north central Minnesota with 1.04 inches of precipitation or 1.97 inches short of normal. .
[see: May 2025 Precipitation Total Map | May 2025 Precipitation Departure Map | May 2025 Climate Summary Table | May 2025 Percent of Normal Precipitation Map] - A prolonged and widespread rainfall event soaked all but the northeastern third of Minnesota with 1 to 3+ inches of rain, from Monday May 19 through Wednesday May 21, 2024.
[see: Widespread Soaking Rains AND Fire Weather?] - The story of May 2025 was of two seasons. The first half of May behaved more like a July in terms of temperatures with some maximum temperatures in the 90s, and the second half of May was like an early spring with some chilly highs in the 40s. Overall May wound up 1.6 degrees above normal in the state. May 2024 was 1.8 degrees above normal. The last time there was a May that finished below normal statewide was May 2020. One of the warmest spots in the state for May 2025 was the “Icebox of the Nation” or International Falls that had 96 degrees on May 11, along with another three other days that hit 90 or above. The coldest temperature of the month found so far was 24 degrees at Brimson in northeast Minnesota on May 10.
[see: Minnesota Climate Trends Tool | May 2025 Climate Summary Table | 2025 May Departure from Normal Temperature Map] - A hot, dry air mass overspread Minnesota beginning on Saturday May 10th, with record high temperatures and an outbreak of wildfires in parts of the state.
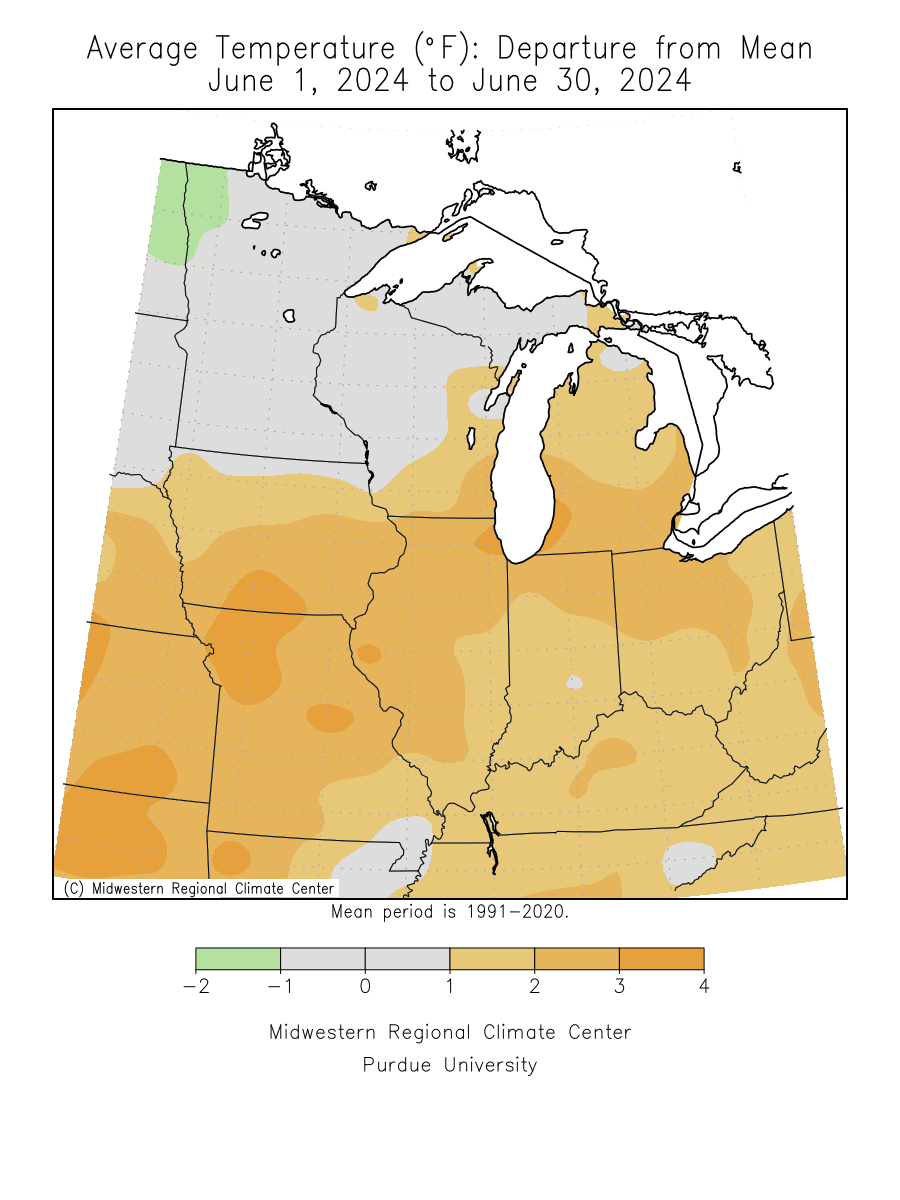
[see: Hot, Fiery Weather, May 10-14, 2025] - June 2025 was warm, with a few days that were quite hot and had at least one day that hearkened back to May. The preliminary average temperature was 66 degrees or .6 degrees above normal. The warmest temperature found was 101 degrees at Marshall in southwest Minnesota and the coldest temperature found was at three locations, Brimson Celena and Embarrass, where the mercury dipped to 31 degrees. Despite the overall month being warm. July 13th was a chilly day across the state with a “high” temperature of only 57 degrees at the Twin Cities and was the second coldest maximum temperature on record for the date.
[see: June 2025 Climate Summary Table | 2025 June Departure from Normal Temperature Map]
Where we stand now:
- Seasonal precipitation so far (April 1 through June 3) shows that there is a surplus of moisture from west central to southeast Minnesota with a deficit in the northwest, along with parts in southwest and northeast Minnesota.
[see: Weekly Precipitation Maps] - There was not a repeat of the wet spring of 2024, so drought persists over portions of the state that began late in the summer of 2024. The U. S. Drought Monitor map released on June 5, shows that 56% of the state has Abnormally Dry conditions, with 15% of the state having Moderate conditions. The U.S. Drought Monitor index is a blend of science and subjectivity where drought categories (Moderate, Severe etc.) are based on several indicators.
[see: Drought Conditions Overview] - The U.S. Geological Survey reports that stream discharge stream flows are showing a wide range from near normal to much below normal in the north. Stream flows are falling fairly rapidly in places like the St. Louis River near Scanlon in Carlton County. In contract, stream flows are above normal to much above normal in the southeast, due to recent rains.
[see: USGS Stream Flow Conditions] - Water levels on most Minnesota lakes vary depending on lake and location in the state. Mille Lacs on June 5 was at 10.93 feet, about six tenths of a foot below the median. Last year at this time the lake was about three quarters of a foot higher. The level on Lake Minnetonka on June 5 was 929.41 feet, very close to the median with 100 cfs flowing through Gray's Bay Dam. White Bear Lake was at 922.82. about three tenths of a foot higher than last year. Lake of the Woods is in the middle of the median band and is trending down. Lake Superior was at 601.48 feet, about 4 tenths of a foot below the median and about two tenths of a foot below last year at this time.
[see: Mille Lacs Lake Water Level | Lake Minnetonka Water Level | White Bear Lake Water Level | Lake of the Woods Control Board Basin Data | Corps of Engineers Great Lakes Water Levels] - The Agricultural Statistics Service on May 27 reported that topsoil moisture across Minnesota is 1 percent Very Short, 14 percent Short, 73 percent Adequate, and 12 percent Surplus. Soil moisture readings at Lamberton on June 1 shows the moisture profile about a half inch below the historical average, but 1.10 inches higher than it was two weeks ago.
[see: Agricultural Statistics Service Crop Progress and Condition | U. of M. Southwest Research & Outreach Center (Lamberton)] - The potential for wildfires is currently rated by DNR Forestry as Low over southern and parts of central Minnesota Moderate fire danger over west central and parts of north central, High and Very High fire danger in the northwest and northeast. Historically, 80 percent of all wildfires in Minnesota occur during April and May.
[see: Fire Danger Rating Map]
Future Prospects
- The precipitation outlook for June 2025 has equal chances for below, normal and above normal precipitation. June precipitation normals range from just over three inches in northwest Minnesota to about five inches in southeastern counties.
[see: Climate Prediction Center 30-day Outlook | June Precipitation Normal Map] - Looking at the Climate Prediction Center, there is a fairly strong tendency for above normal temperatures for June 2025 in Minnesota. Normal June high temperatures are in the low to mid 70s early in the month, rising to around 80 by month's end. Normal June low temperatures are in the low 50s to start the month, and rise to around 60 as the month ends.
[see: Climate Prediction Center 30-day Outlook | June Temperature Normal Map] - The 90-day precipitation outlook for June through August indicates equal chances for above, normal and below normal precipitation for the northeast, with a tilt to below normal precipitation for the rest of Minnesota, with the greatest chance in the west. . The June through August temperature projection shows a tendency for above normal temperatures across not only the state, bit all of the lower 48 states.
[see: Climate Prediction Center 90-day Outlook]
From the author:
- Large wildfires in the Canadian forests of Manitoba and Saskatchewan produced heavy plumes of smoke that drifted over adjacent areas and got funneled into Minnesota on a series of wind shifts, beginning towards the end of May and lasting into June. Some of the smoke appeared to thicken as rain fell. The thickest smoke was with a rain event on June 3, with visibilities going town to 1-2 miles in some locations.
[see: A Wet and Warm Spring 2025 in Minnesota.]
Upcoming dates of note:
- June 19: National Weather Service releases 30/90-day temperature and precipitation outlooks