A monthly electronic newsletter summarizing Minnesota's climate conditions and the resulting impact on water resources. Distributed on the first Thursday of the month.
State Climatology Office - DNR Division of Ecological and Water Resources, St. Paul
distributed: November 7, 2019
What happened in October 2019:
- The wet pattern continued in October 2019. The preliminary statewide average precipitation was 4.10 inches, 1.78 inches above normal and the 9th wettest October on record (1895-2010.) October 2018 was the 12th wettest on record. The wettest locations were in the northeast and south central parts of the state. Wolf Ridge Environmental Learning Center in Lake County reported 6.98 inches or 3.65 inches above normal. The town of Wells in Faribault County reported 6.99 inches or 4.84 inches above normal. Some of the precipitation fell as snow across the state in the middle of the month.
[see: October 2019 Precipitation Total Map | October 2019 Precipitation Departure Map | October 2019 Climate Summary Table | October 2019 Percent of Normal Precipitation Map]
Some notable events include: - The first widespread snow event of the season took place on October 10-12. While North Dakota saw the highest snowfall totals, northwest Minnesota saw some heavy snow as well, especially in the Red River Valley. Ten inches of snow was reported in east Grand Forks and eight inches at Hawley.
[see: October 10-12, 2019 Blizzard] - A high wind and heavy rain event hit the state on October 21. The Duluth International Airport had a wind gust of 61mph with a peak gust of 74 mph on the Blatnik Bridge. Street flooding was reported in Canal Park. The Duluth Water Level Observation Station located in Duluth Harbor may have set a new all-time Lake Superior Level record with a reading of 604.75 feet, breaking the old record of 604.42 recorded in 1985. One to three inches of rain also fell with one of the higher totals near Hackensack with 3.05 inches.
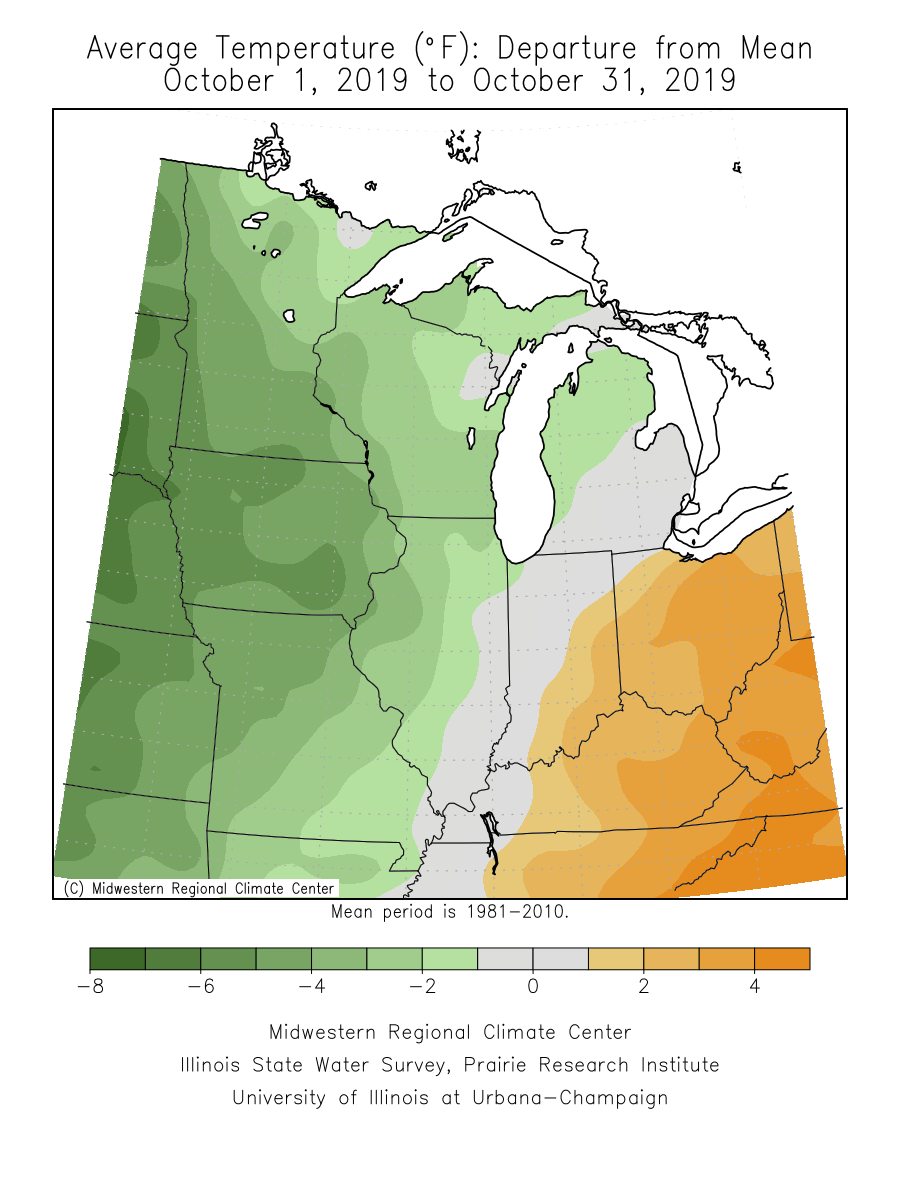
[see: Oct 21, 2019 High Wind and Rain] - While October 2019 was wetter than October 2018, it wasn’t quite as cold. The preliminary statewide average for October 2019 was 42.8 degrees or 2.3 degrees below normal. The highest temperature for the month was 91 degrees at Theilman on October 1st. The warm conditions were actually on September 30, but due to the reporter’s time of observation the reading was recorded on October 1. The coldest reading found was 12 degrees at Brimson in St. Louis County on the 30th.
[see: October 2019 Climate Summary Table | 2019 October Departure from Normal Temperature Map]
Where we stand now:
- The wet year of 2019 continues with seasonal precipitation totals (April 1 through November 5) ranked above the historical median over all but a portion of St. Louis County. Most of the state is in the 85th percentile ranking for precipitation with large areas of central and southern Minnesota in the 95th percentile. Much of southern Minnesota was in the 98% ranking for the growing season or nearly the wettest on record.
[see: Precipitation Maps for November 5, 2019] - A touch of winter arrived in southern Minnesota in early November. Snow depths as of November 7 range from one to four inches in southern Minnesota and a around an inch or so in the far north.
[see: NWS Snow Depth Estimation Map | Midwest Regional Climate Center Snow Depth Map] - The U. S. Drought Monitor map released on November 7, depicts Minnesota free of any drought designation. Last year at this time, about 5% of the state was Abnormally Dry. The U.S. Drought Monitor index is a blend of science and subjectivity where drought categories (Moderate, Severe, etc.) are based on several indicators.
[see: Drought Conditions Overview] - The U.S. Geological Survey reports that stream discharge values are much above normal to high across most of Minnesota. In general, the rivers are slowly falling from the readings seen in late October.
[see: USGS Stream Flow Conditions] - Water levels on most Minnesota lakes vary depending on lake and location in the state. Mille Lacs was well above the median lake level for early November. On November 6, Minnetonka was at 929.03 feet with 150 cfs flowing through Gray's Bay Dam. White Bear Lake was at 925.06 feet on November 7, a rise of 1 foot from one year ago and 6.22 feet from the record low of 918.84 feet from January 10, 2013. Water has been flowing out of the outlet at White Bear Lake since April. Both Rainy Lake and Lake of the Woods are well above the median range for November. In fact, Lake of the Woods was above the 90th percentile for early November. Lake Superior was forecasted to be at 603.92 feet on November 1, sixteen inches higher than the monthly average for early November.
[see: Mille Lacs Lake Water Level | Lake Minnetonka Water Level | White Bear Lake Water Level | Lake of the Woods Control Board Basin Data | Corps of Engineers Great Lakes Water Levels] - The Agricultural Statistics Service on November 4 reports that topsoil moisture across Minnesota is 0 percent Very Short, 1 percent Short, 61 percent Adequate, and 38 percent Surplus. Soil moisture levels at Lamberton and Waseca are above the historical median.
[see: Agricultural Statistics Service Crop Progress and Condition | U. of M. Southwest Research and Outreach Center (Lamberton) | U. of M. Southern Research and Outreach Center (Waseca)] - The potential for wildfires is currently rated by DNR Forestry as Low across Minnesota. Historically, 80 percent of all wildfires in Minnesota occur during April and May.
[see: Fire Danger Rating Map]
Future prospects:
- The November precipitation outlook leans towards equal chances of above, normal and below normal precipitation. November precipitation normals range from about three-quarters of an inch in northwest Minnesota to about two-and-a-half inches in Cook County. Southern and central Minnesota range by about one-and-a-quarter of an inch in the southwest to about two-inches and a quarter in south central Minnesota.
[see: Climate Prediction Center 30-day Outlook | November Precipitation Normal Map] - The November temperature outlook has a tendency for below normal temperatures, especially in the north. Through November 6th statewide average temperatures are about eight to eleven degrees below normal. Normal November high temperatures are in the 40s to start the month, dropping to the 30s by month's end. Normal lows are in the 30s to upper 20s early in the month, falling to the teens by late November.
[see: Climate Prediction Center 30-day Outlook | November Temperature Normal Map] - The 90-day temperature outlook for November through January has equal chances of above below and normal temperatures, with a tendency of above normal precipitation in the central and south.
[see: Climate Prediction Center 90-day Outlook] - The National Weather Service produces long-range probabilistic river stage and discharge outlooks for the Red River, Minnesota River, and Mississippi River basins. These products address both high flow and low flow probabilities.
[see: National Weather Service - North Central River Forecast Center]
From the author:
- It’s been a very wet year for many across Minnesota. Looking at precipitation totals from January through October, locations in southern Minnesota are near or already broken their annual records. Rochester passed up its annual record of 43.94 inches in September and as of November 6th is at 51.62 inches with still more days to go on the calendar. On November 7, the Twin Cities was at 39.28 inches and this is enough for 2019 to be the 4th wettest year on record. The wettest year on record for the Twin Cities is 2016 with 40.32 inches.
- ENSO neutral conditions are forecast to be present though the winter and into the spring. The Winter Outlook (December-February) from the Climate Prediction Center has equal chances for below above and normal temperatures, with a tilt to colder than normal temperatures from January-March. The precipitation outlook is for a tendency for above normal precipitation. [see: Climate Prediction Center January-March Outlook]
Upcoming dates of note:
- November 14: National Weather Service releases 30/90 day temperature and precipitation outlooks
![]() Subscribe to email announcements of the monthly posting of this product.
Subscribe to email announcements of the monthly posting of this product.
Pete Boulay, DNR Climatologist