A monthly electronic newsletter summarizing Minnesota's climate conditions and the resulting impact on water resources. Distributed on the first Thursday of the month.
State Climatology Office - DNR Division of Ecological and Water Resources, St. Paul
distributed: November 10, 2025
What happened in October 2025:
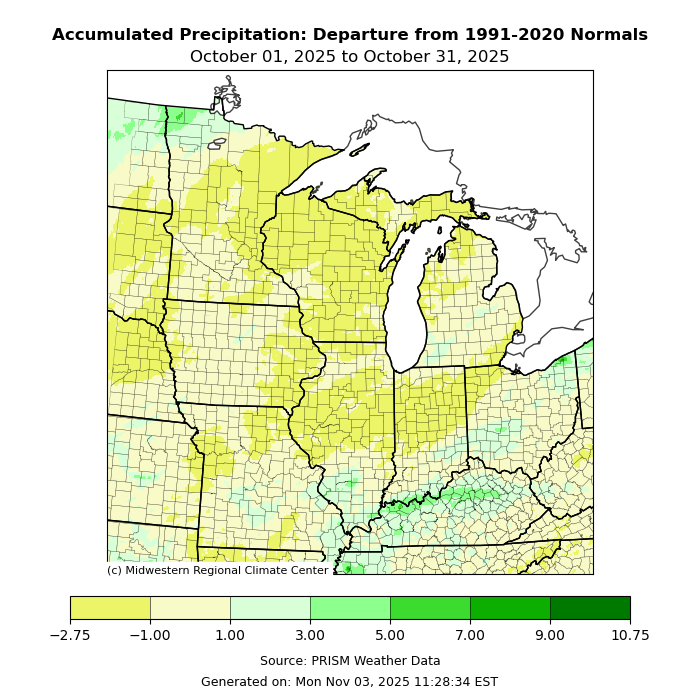
- October 2025 continued the recent trend of warm and dry Octobers. The preliminary statewide average precipitation for the month was 1.62 inches, or 1.05 inches below normal. While most of the state was drier than normal, an exception was in the northwest corner where some locations exceeded normal October precipitation by several inches. Lake Bronson in Kittson County reported the highest precipitation for the month with 7.82 inches, or about five inches above normal. One of the direst locations was Cloquet in Carton County, with .45 inches or 2.81 inches below normal.
[see: October 2025 Precipitation Total Map | October 2025 Precipitation Departure Map | October 2025 Climate Summary Table | October 2025 Percent of Normal Precipitation Map] - There weren’t any significant precipitation events of note for October, 2025. There wasn’t even a single severe storm report noted during the month in Minnesota according to the Storm Prediction Center. On October 4, there were gusty winds from the south associated with the record-breaking heat. At the Twin Cities International Airport there was a gust to 48mph.
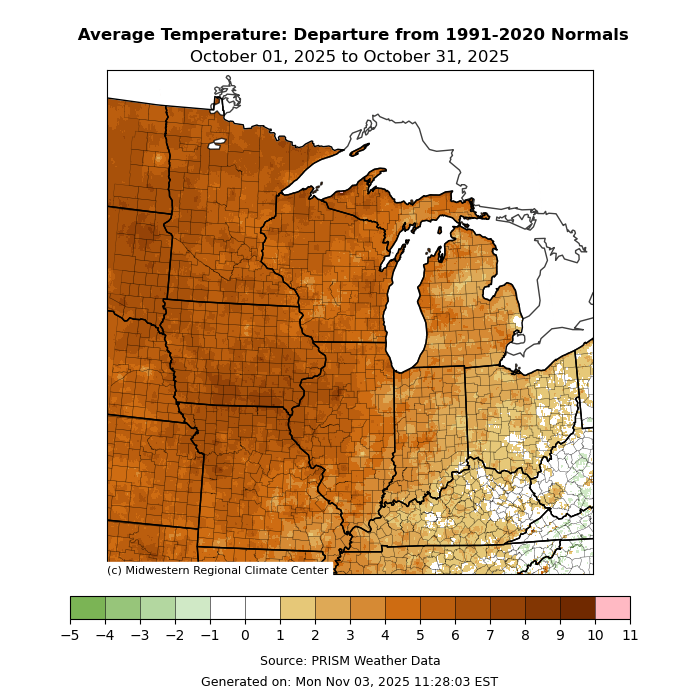
[see: Intense Early October Heat] - The preliminary statewide average for October 2025 was 51.7 degrees or about 5.9 degrees above normal. This was the fifth October in a row to finish above normal. The last time the statewide average temperature for October was below normal was October 2020. The highest temperature for October 2025 found so far was 94 degrees at Granite Falls on October 3rd . The coldest temperature found so far in Minnesota was 16 degrees at Brimson.
[see: October 2025 Climate Summary Table | 2025 October Departure from Normal Temperature Map]
Where we stand now:
- Seasonal precipitation totals (April 1 through October 28) showed that the north half of the state finished with below normal precipitation. Areas in west central Minnesota wound up with a surplus of moisture, much of which fell in June and July. Canby in Yellow Medicine County saw 33.42 inches from April 1 to the end of October and was 11.19 inches above normal. Southern Minnesota has a mosaic of above and below normal precipitation. Rochester and Albert Lea finished with close to normal precipitation for the growing season.
[see: Seasonal Precipitation Ranking Maps] - The U. S. Drought Monitor map released on November 6, depicts that 37% of the state is free of any drought designation. 41% of the state in the Abnormally Dry category, 30% is in the Moderate Drought category, and 2% is in the Severe Drought category. This is the first time there was Severe Drought coverage since July 15, 2025. The U.S. Drought Monitor index is a blend of science and subjectivity where drought categories (Moderate, Severe, etc.) are based on several indicators.
[see: Drought Conditions Overview] - The U.S. Geological Survey reports that stream discharge values on November 5 ranged from near normal in the south, to much above normal in the west central. In general stream flows are below normal to much below normal in the north, with the exception of the northwest which was much above normal. The Mississippi from the headwaters to Brainerd has been much below normal for the past month. The St. Croix River has also been below to much below normal in recent weeks as well.
[see: USGS Stream Flow Conditions] - Water levels on Minnesota lakes vary depending on lake and location in the state. Mille Lacs on November 5 was at 10.24 feet, less than a tenth of a foot from the long term mean of 10.29 feet. On October 31, lake Minnetonka was at 928.54 feet. Greys’ Bay Dam closed on October 17 after being open for 155 days. White Bear Lake was at 922.94 feet, a .46 tenth of a foot rise from one year ago and .75 tenths of a foot higher than two years ago at this time. Both Rainy Lake and Lake of the Woods were both in the median band on November 5. Lake Superior was forecast to be at 601.71 feet on November 4, three tenths of a foot higher than last year and .26 tenths of a foot lower than the long term average for November.
[see: Mille Lacs Lake Water Level | Lake Minnetonka Water Level | White Bear Lake Water Level | Lake of the Woods Control Board Basin Data | >Corps of Engineers Great Lakes Water Levels - The Agricultural Statistics Service issued their final report before shutdown on September 28. The topsoil moisture across Minnesota was 15 percent Very Short and Short, 75 percent Adequate, and 10 percent Surplus. Soil moisture levels at Lamberton on November 1 showed a 1.16 inch surplus of moisture in the profile when compared to the historic averages.
[see: Agricultural Statistics Service Crop Progress and Condition | U. of M. Southwest Research and Outreach Center (Lamberton) | U. of M. Southern Research and Outreach Center (Waseca)] - The potential for wildfires on November 10, 2025 is currently rated by DNR Forestry as Low across southwest, south central and northern Minnesota and Moderate over south east and central parts of the state. In the center of the state was a pocket of High fire danger. Historically, 80 percent of all wildfires in Minnesota occur during April and May.
[see: Fire Danger Rating Map]
Future prospects:
- The November precipitation outlook leans towards equal chances of below, above, and normal precipitation. November precipitation normals range from about three-quarters of an inch in northwest Minnesota to about two-and-a-half inches in Cook County. Southern and central Minnesota range by about one-and-a-quarter of an inch in the southwest to about two-inches and a quarter in south central Minnesota.
[see: Climate Prediction Center 30-day Outlook | November Precipitation Normal Map] - The November temperature outlook has a fairly strong tendency for above normal temperatures statewide. Normal November high temperatures are in the 40s to start the month, dropping to the 30s by month's end. Normal lows are in the 30s to upper 20s early in the month, falling to the teens by late November.
[see: Climate Prediction Center 30-day Outlook | November Temperature Normal Map] - The 90-day temperature outlook for November through January is leaning towards equal chances for below, normal and above normal temperatures, with a slight tilt towards above normal precipitation for all but the southwest.
[see: Climate Prediction Center 90-day Outlook] - The National Weather Service produces long-range probabilistic river stage and discharge outlooks for the Red River, Minnesota River, and Mississippi River basins. These products address both high flow and low flow probabilities.
[see: National Weather Service - North Central River Forecast Center]
From the author:
- According to the October El Niño-Southern Oscillation (ENSO) Outlook, there is about a 55% chance of La Niña from December-February 2026 and is expected to weaken through February-April 2026. The Outlook for December 2025-February 2026 has a slight tilt for above normal precipitation and below normal temperatures across most of Minnesota. Will this mean more snow? We will have to wait and see!
[see: Climate Prediction Center December-January Outlook]
Upcoming dates of note:
- November 20: National Weather Service releases 30/90 day temperature and precipitation outlooks
![]() Subscribe to email announcements of the monthly posting of this product.
Subscribe to email announcements of the monthly posting of this product.
Pete Boulay, DNR Climatologist