A monthly electronic newsletter summarizing Minnesota's climate conditions and the resulting impact on water resources. Distributed on the first Thursday of the month.
State Climatology Office - DNR Division of Ecological and Water Resources, St. Paul
distributed: October 4, 2018
What happened in September 2018:
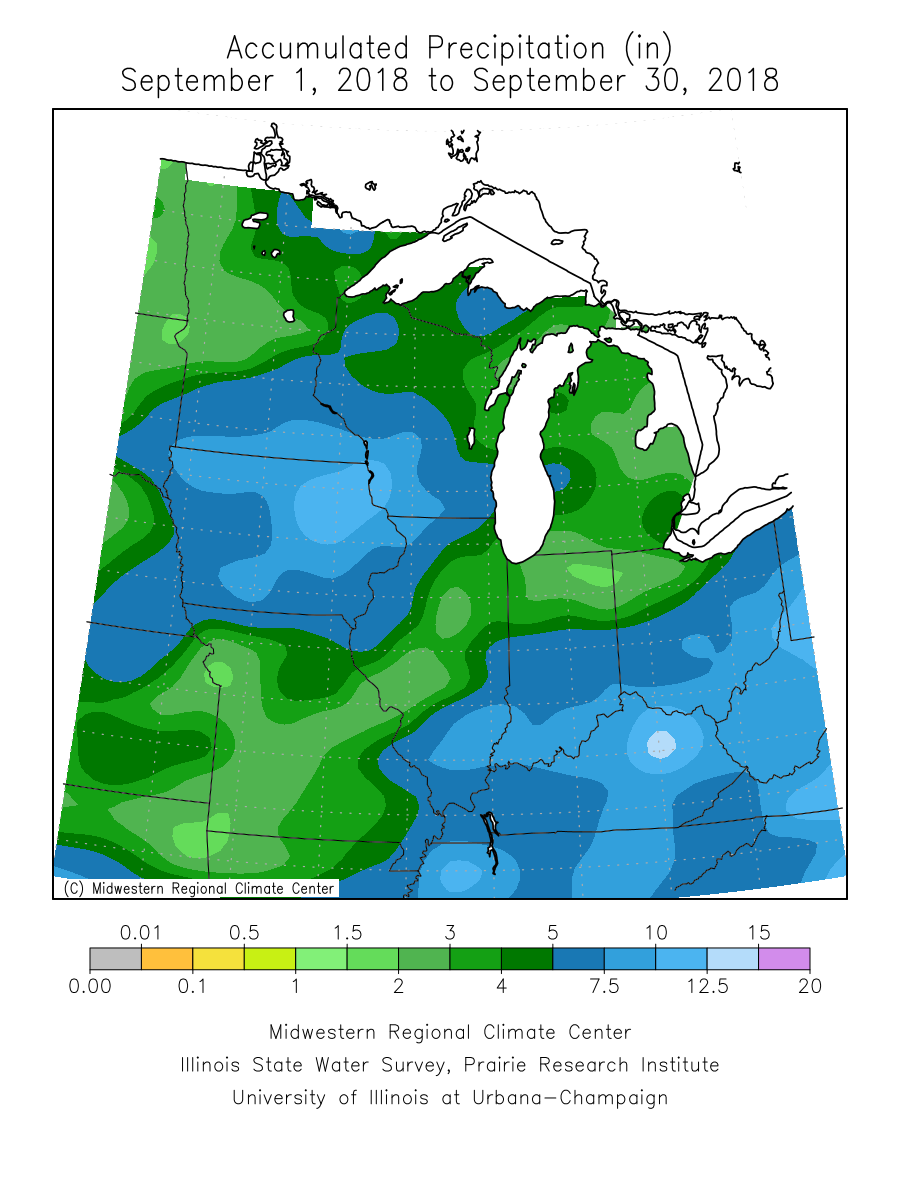
- September 2018 finished above normal for precipitation statewide. The preliminary average for Minnesota was 5.48 inches or 2.16 inches above normal. While many places in Minnesota finished well above normal for precipitation in the state, this was by no means universal. Places in central Minnesota fell short of normal around an inch. One of the driest locations was St. Cloud, where the monthly total was 2.17 inches or 1.29 inches below normal. Many places in southern Minnesota saw two to three times the normal precipitation for September, including a whopping 10.54 inches at Waseca, 6.87 inches above normal. It was the sixth wettest September on record in Rochester with 7.58 inches of rain.
[see: September 2018 Precipitation Total Map | September 2018 Precipitation Departure Map | September 2018 Climate Summary Table | September 2018 Percent of Normal Precipitation Map] - September 2018 had two severe storm episodes of note for the month:
- A well-forecast heavy precipitation event drenched the already soggy southeast part of Minnesota with four to six inch rains on September 3-5. The heaviest rains fell in a line from near Austin and Albert Lea, northeastward though Waseca and Zumbrota and across the Mississippi River into Wisconsin. The highest total from a volunteer rain gauge was 6.02 inches 4.7 miles north of Rochester.
[see: Heavy Rains Again in the Southeast: September 3-5, 2018] - After a relatively quiet summer severe storm season, there was an outbreak of tornadoes on September 20. The count from the National Weather Service shows that 17 tornadoes touched down in south central and southeast Minnesota. These tornadoes and winds with the thunderstorms caused widespread damage.
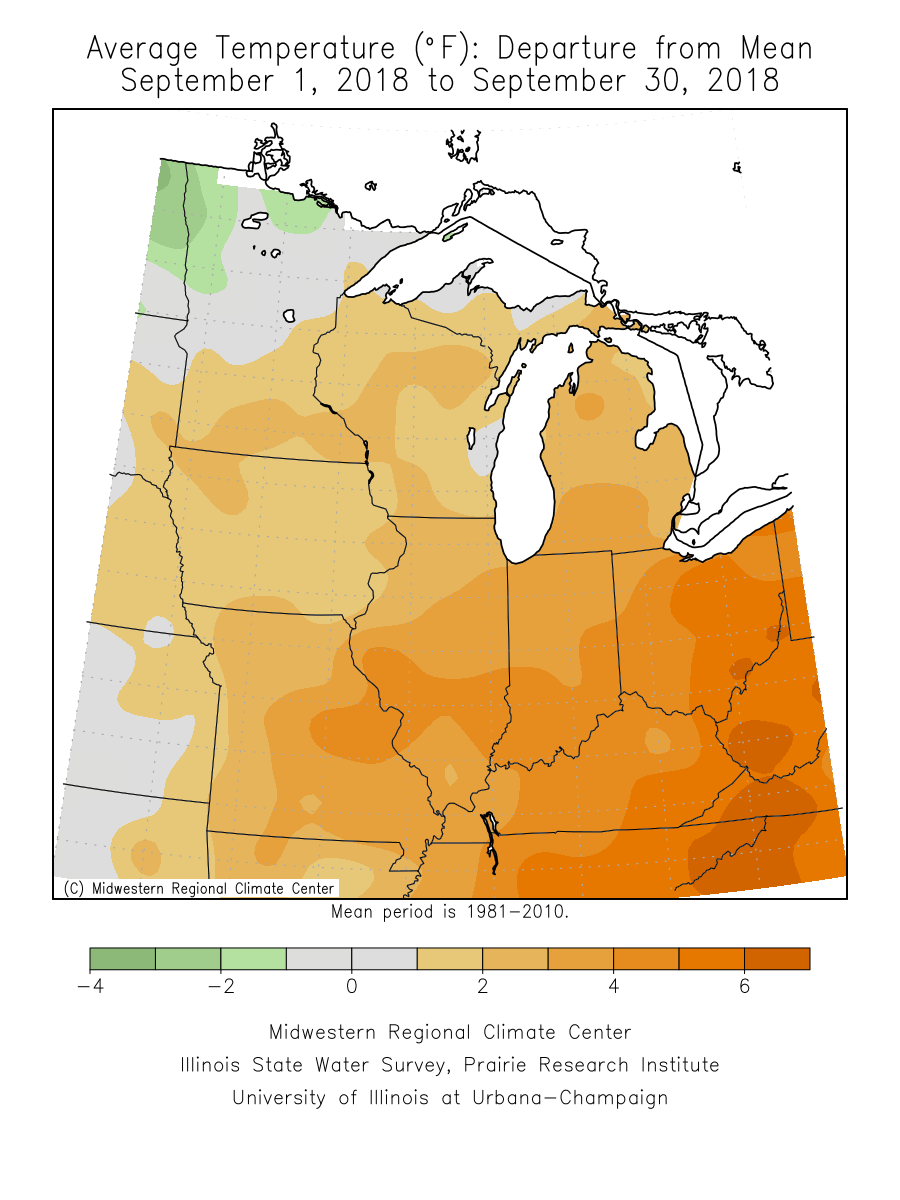
[see: Heavy Rains, High Winds and Tornadoes: September 20, 2018] - Much of September was warm and summerlike for Minnesota, with a cooling trend by the end of the month. Most places in central and southern Minnesota finished around three degrees above normal, with the cold finish balancing out the mild conditions over the north. The preliminary statewide average temperature was 1.6 degrees above normal. The first widespread frost was on September 29th, effectively ending the growing season over many places in central and southern Minnesota, away from the Twin Cities. This is close to the average for the first frost. The warmest temperature found for September was 95 degrees on September 16 at Benson, Canby and Milan and the coldest temperature found for the month was 20 degrees at near Goodrich in northwest Minnesota.
[see: September 2018 Climate Summary Table | 2018 September Departure from Normal Temperature Map]
Where we stand now:
- Seasonal precipitation totals (April 1 through October 2) ranked above the historical median over southern and parts of east central and northeast Minnesota. A large part of southern Minnesota was in the 98 percentile for the wettest growing season. Northwest and far northeast Minnesota is near to below normal ranking. A portion of far northwest are well below the median.
[see: Seasonal Precipitation Ranking Map] - The U. S. Drought Monitor map released on October 2, depicts a very small area in northwest Minnesota in the Severe Drought category. Eight percent of the state is in the Moderate Drought category confined to northwest and north central Minnesota. A good portion of northwest, north central and part of northeast Minnesota is Abnormally Dry. Last year at this time 89% of the state was free of any drought designation, compared to 75% on October 2. The U.S. Drought Monitor index is a blend of science and subjectivity where drought categories (Moderate, Severe, etc.) are based on several indicators.
[see: Drought Conditions Overview] - The U.S. Geological Survey reports that stream discharge values are much above normal across large sections of southern Minnesota. Below normal to normal flows are in the central and north. Sprague Creek along the Canadian Border in Roseau County is much below normal.
[see: USGS Stream Flow Conditions] - Water levels on most Minnesota lakes vary depending on lake and location in the state. Mille Lacs was well above the median lake level for September. On October 4, Minnetonka was at 928.72 with 50 cfs flowing through Grays Bay Dam. White Bear Lake was at 923.98 feet on October 4, a rise of .88 feet from one year ago and a rise of 5.14 feet from the record low of 918.84 measured January 10, 2013. Rainy and Lake of the Woods are in the median range for September. This is the first time that the lake levels for Lake of the Woods has been in the median range since March, 2018. Lake Superior was at 602.76 feet on September 28, seven inches higher than the monthly average for September.
[see: Mille Lacs Lake Water Level | Lake Minnetonka Water Level | White Bear Lake Water Level | Lake of the Woods Control Board Basin Data | Corps of Engineers Great Lakes Water Levels] - The Agricultural Statistics Service on October 1 reports that topsoil moisture across Minnesota is 1 percent Very Short, 4 percent Short, 75 percent Adequate, and 20 percent Surplus. Maturity of corn was twelve days ahead of the five year average and soybeans were two weeks ahead of average. Damp field conditions is making harvest a challenge. Soil moisture levels at Lamberton and Waseca are well above the historical median. The soil moisture level at Lamberton is 2.74 inches above the historic average and matches the very wet reading from early October 2016
[see: Agricultural Statistics Service Crop Progress and Condition | U. of M. Southwest Research and Outreach Center (Lamberton) | U. of M. Southern Research and Outreach Center (Waseca)] - The potential for wildfires is currently rated by DNR Forestry as Low across Minnesota. Historically, 80 percent of all wildfires in Minnesota occur during April and May.
[see: Fire Danger Rating Map]
Future prospects:
- It looks like the wet and cool pattern from the beginning of October is forecast to continue though the month. The October precipitation outlook leans towards above normal precipitation across the entire state, especially in the south and east central. October precipitation normals range from about one-and-a-half inches in northwest Minnesota to about three-and-a-half inches in Cook County. Southern and central Minnesota range by about one-and-three-quarters of an inch in the southwest to about two-and-a-half inches in east central Minnesota.
[see: Climate Prediction Center 30-day Outlook | October Precipitation Normal Map] - The October temperature outlook leans towards below normal temperatures throughout Minnesota for October, with the best chance in the northwest. A small area of southeast Minnesota is in the equal chance category for above normal and below normal temperatures. Normal October high temperatures are in the 60's to start the month, dropping to the low 50's to upper 40's by month's end. Normal lows are in the 40's early in the month, falling to the 30's by late October.
[see: Climate Prediction Center 30-day Outlook | October Temperature Normal Map] - The 90-day temperature outlook for October through December has a tendency of above normal temperatures. The 90-day precipitation outlook for October through December indicates equal chances of below-normal, near-normal, or above-normal conditions across most of Minnesota.
[see: Climate Prediction Center 90-day Outlook] - The National Weather Service produces long-range probabilistic river stage and discharge outlooks for the Red River, Minnesota River, and Mississippi River basins. These products address both high flow and low flow probabilities.
[see: National Weather Service - North Central River Forecast Center]
From the author:
- What will this winter bring? ENSO-neutral conditions are favored though October and El Nino conditions favored thereafter. The Climate Prediction Center is betting on an El Nino Winter with a tendency for above normal temperatures from December- February. The precipitation outlook for meteorological winter is equal chances for below, above and normal precipitation. Stay tuned.
[see: Climate Prediction Center December-February Outlook] - Caledonia has a shot at breaking the annual statewide precipitation record. As of October 4 the precipitation total at Caledonia so far this year is at 49.67 inches. The state record is 56.24 inches at Waseca in 2016. The normal annual precipitation at Caledonia is 36.93 inches.
Upcoming dates of note:
- October 18: National Weather Service releases 30/90 day temperature and precipitation outlooks
![]() Subscribe to email announcements of the monthly posting of this product.
Subscribe to email announcements of the monthly posting of this product.
Pete Boulay, DNR Climatologist