What is the quality of terrestrial habitat in each watershed based on its size, configuration and cover type?
 Quality habitat should be large enough to support plant and animal interactions over time. Larger areas that are round rather than long and narrow contain more habitats and may be more likely to support diverse plant and animal populations. However, the definition and assessment of habitat quality is complex because the ability of a particular habitat to provide the necessary components for a species is dependent upon which species is being investigated. For example, small fragments of habitat with unique conditions may harbor plant microhabitats. Thus, small habitat may contain rare plant habitat, which may maintain important genetic material.
Conversely, some organisms need larger areas, such as Ovenbirds and other ground-nesting forest songbirds, which require large, intact forest tracts (Mattsson and Niemi 2006). Fragmentation of vegetation may reduce nest success of Ovenbirds. Small, irregular shaped areas have a greater proportion of edge area than interior area. More birds may be forced to nest in the edges where there is a greater risk of nest predators (Chalfoun et al. 2002). In other words, it is hard to determine if it is “good” habitat unless it is known what species live and thrive there.
For this reason, the habitat quality index uses the different habitat needs of representative forest, wetland and grassland species to determine whether remaining habitat configurations meet the needs of those particular species. The species selected and the habitat configurations used for this index are based on the methods developed for the Regionally Significant Ecological Areas modeling done by the DNR in their Metro Region. The species used in the forest model included: the Red-Eyed Vireo, Wood Thrush, Scarlet Tanager, Ovenbird, Eastern Wood Pewee, Cerulean Warbler, Louisiana Waterthrush, and the Red-Shouldered Hawk. The species used for the grassland model included: bull snake, pocket mouse, and Blanding's turtle.
Quality habitat should be large enough to support plant and animal interactions over time. Larger areas that are round rather than long and narrow contain more habitats and may be more likely to support diverse plant and animal populations. However, the definition and assessment of habitat quality is complex because the ability of a particular habitat to provide the necessary components for a species is dependent upon which species is being investigated. For example, small fragments of habitat with unique conditions may harbor plant microhabitats. Thus, small habitat may contain rare plant habitat, which may maintain important genetic material.
Conversely, some organisms need larger areas, such as Ovenbirds and other ground-nesting forest songbirds, which require large, intact forest tracts (Mattsson and Niemi 2006). Fragmentation of vegetation may reduce nest success of Ovenbirds. Small, irregular shaped areas have a greater proportion of edge area than interior area. More birds may be forced to nest in the edges where there is a greater risk of nest predators (Chalfoun et al. 2002). In other words, it is hard to determine if it is “good” habitat unless it is known what species live and thrive there.
For this reason, the habitat quality index uses the different habitat needs of representative forest, wetland and grassland species to determine whether remaining habitat configurations meet the needs of those particular species. The species selected and the habitat configurations used for this index are based on the methods developed for the Regionally Significant Ecological Areas modeling done by the DNR in their Metro Region. The species used in the forest model included: the Red-Eyed Vireo, Wood Thrush, Scarlet Tanager, Ovenbird, Eastern Wood Pewee, Cerulean Warbler, Louisiana Waterthrush, and the Red-Shouldered Hawk. The species used for the grassland model included: bull snake, pocket mouse, and Blanding's turtle.
Why is this important for biology?
Areas with native and natural vegetation may provide habitat for a number of species, but habitat should also be large enough to support plant and animal interactions over time. The assessment of habitat quality is complex because the ability to provide the necessary components for a species is dependent upon which species is being investigated. For this reason, the habitat quality index uses the different habitat needs of representative forest, wetland and grassland species to determine whether remaining habitat configurations meet the needs of those particular species. The species selected and the habitat configurations used for this index are based on the methods developed for the Regionally Significant Ecological Areas modeling done by the DNR. Areas with native and semi-natural vegetation provide important habitat for a number of species. The size, shape and cover type of terrestrial habitat influence the productivity, accessibility and sustainability of the plant and animal communities dependent upon those habitats.Terrestrial Habitat Quality Score
Creating the Index
- Input Data
- Calculating the index
- The Terrestrial Habitat Quality Index is based on five ecosystem-specific habitat models derived from a custom land cover model. The input data for the custom land cover model includes: the National Land Cover Database 2006 (NLCD, 2006), USDA cropland data layer (2010), National Wetland Inventory (NWI) data, DNR forest stand age information, and MNDOT roads. The five models test the position, size and adjacency of different land cover types against habitat preferences of key indicator species associated with that ecological biome. The five habitat models for the state-wide analysis include:
- Forest Interior
- Tall Grasslands
- Wetland Complex
- Floodplain Forest
- Prairie Pothole
((Area of ‘Good’ Habitat x 70) + (Area of ‘Better’ Habitat x 85) + (Area of ‘Best’ Habitat x 100))
/ Total Watershed Land Area
Index Results
- Interpretation of results
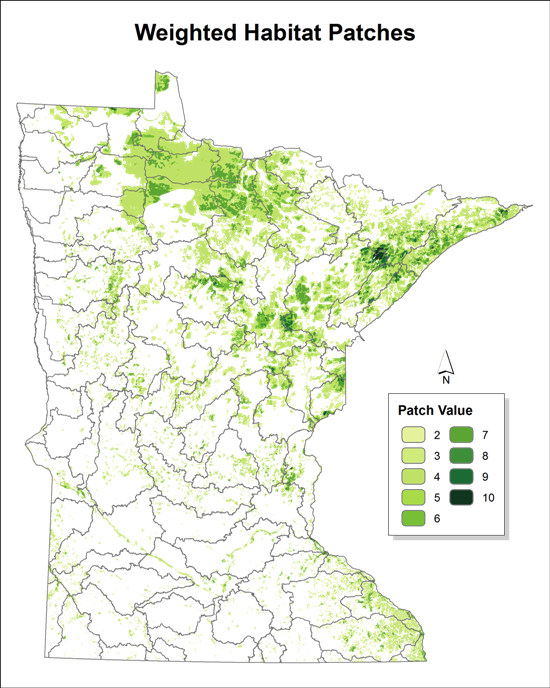
- There were more terrestrial habitat patches in the northeast, with moderate values in small areas in the southeast and east central and north. Most of southern and western watersheds have low terrestrial habitat quality scores. Although there are areas of Minnesota that have significant pockets of high quality habitat, in most areas of the state, the configuration of that habitat does not meet the requirements of the representative species. Due to the large amount of fragmentation from agriculture, urban development, forest harvest, mining and other uses, the habitat value of remaining patches has been reduced. There is a pattern of poor habitat quality throughout the southern half of Minnesota and the Red River Valley. There are some low scores in the north and northeast where large expanses of forested land cover, wetlands, and lakes dominate the landscape. Some of the low scores are due to forest harvest and “blow down” of trees. Additionally, some low scores may be the result of fragmentation of terrestrial habitat by open water. The fragmentation by open water reduces the value of the terrestrial habitat in the modeling process.
- Relationship to other health components
Water quality
High water quality is correlated with large tracts of perennial cover and wide riparian areas. The same configuration of land cover that scores as high value habitat also serves to protect adjacent water bodies by filtering contaminants, reducing erosion and moderating temperature.Connectivity
The pattern of remaining quality habitat across the landscape often follows Minnesota’s streams and rivers. These habitat corridors contribute to the health of both the terrestrial and aquatic systems (see the Riparian Connectivity and Terrestrial Connectivity indexes). The Terrestrial Habitat Quality Index is used as a base for the Terrestrial Habitat Connectivity Index that ranks potential connections between quality habitats. Increasing the size of these existing natural networks would enhance and connect the movement of organisms, nutrients and energy through Minnesota’s watersheds.Geomorphology
The patterns of historic land cover correspond directly to the soil types and climate patterns of Minnesota. The geology and glacial history of the state greatly influence the location of expected habitat types and species. The ecological setting is key to understanding the expected habitat and the degree to which the current landscape deviates from past conditions.Hydrology
Terrestrial habitat quality is directly related to perennial land cover. The low scoring areas in most cases have much less perennial cover and are most likely to experience high runoff, lowered rates of groundwater recharge and less transpiration and more erosion, whereas areas with high quality habitat likely experience less runoff, more groundwater recharge, and less erosion, and more evapotranspiration.
Supporting Science
- Scientific literature support
- An extensive literature review was part of the Regionally Significant Ecological Areas (RSEA) Modeling Project done by the DNR in their Metro Region. The same basic approach was applied to this statewide analysis, so the literature from that effort serves to also enforce the validity and importance of this index. A major focus of the RSEA was to identify, and when possible, maintain the remaining large habitat areas in the landscape. A number of studies in Minnesota and other states have evaluated the size of habitat patches relative to productivity, accessibility, and sustainability of plants and animals. All things being equal, large areas of habitat support more diverse species than smaller areas, especially for birds or mammals. For example, large tracts of public forest land and private industrial forest land are both important in managing for a broad-ranging animal, such as the wolf (Mladenoff et al. 1995). However, habitat size can be relatively small and still maintain many plants and small, non-migratory animals. In the Midwest, Temple and Cary (1988) recommend areas of forest habitat should be large enough to allow for a 200 m edge buffer for interior forest bird populations. Keller et al. (1993) reported that forest tracts wider than 100 m had more neotropical migrant species and the birds continued to increase in numbers but much more gradually in forests wider than 200 m. Robbins et al. (1989) studied birds in the Mid-Atlantic United States and found that several species were not detected in forests less than 10 ha in area. Friesen et al. (1995) studied woodland sizes relative to neotropical bird abundance and found 4 ha woodlots without any nearby houses had on average more bird community abundance than 25 ha woodlots in urban areas. Small areas may be sufficient to maintain vegetation communities. Levenson (1981:38) estimated that dry, midwestern forest areas must be larger than 3.8 ha to sustain forest-interior vegetation communities. Watkins et al. (2003) examined the distribution of understory plants and relationships to unpaved forest roads in a northern hardwood forest landscape in the Chequamegon National Forest, Wisconsin and found that species richness of vegetation was similar to forest interior levels within 5 m from the road. Chalfoun et al. (2002) reported that forest edges in agricultural landscapes may attract a greater numbers of nest predator species than forest interiors, but found that forest vegetation structure was very similar between edge and interior, suggesting that differences in predator abundance and species richness were not driven by variation in habitat structure. Lehtinen et al. (1999) reported the species richness of 10 amphibians was lower with greater wetland isolation and road density in urban and agricultural regions of central and southwestern Minnesota. The reduction in amphibians was likely because the majority of adult amphibians travel no further than 200 or 300 m from a home pond to foraging or over-wintering sites (Rothermel et al., 2002). Gibbs (2000) suggests wetlands greater than 1 acre (0.4 ha) are likely the minimum size to sustain the wetland organisms. In addition to maintaining a wetland of a minimum size the habitat that surrounds a wetland is important. Shisler et al. (1987) suggests vegetation widths of 30 and 45 meters around wetlands is important for wildlife, especially in urban environments. The RSEA used 16 hectares as the minimum size for tall grasslands with a minimum width of 90 meters, because large patches of grassland habitat have been recommended for grassland birds in North America (Winter et al. 2006). Density of three grassland bird species in North Dakota and Minnesota was influenced by size of the habitat, landscape, region, and local vegetation structure (Winter et al. 2006).
- Confidence in index
- An extensive literature review was part of the Regionally Significant Ecological Areas (RSEA) Modeling Project done by the DNR in their Metro Region. The same basic approach was applied to this statewide analysis, so the literature from that effort serves to also enforce the validity and importance of this index. A major focus of the RSEA was to identify, and when possible, maintain the remaining large habitat areas in the landscape. A number of studies in Minnesota and other states have evaluated the size of habitat patches relative to productivity, accessibility, and sustainability of plants and animals. All things being equal, large areas of habitat support more diverse species than smaller areas, especially for birds or mammals. For example, large tracts of public forest land and private industrial forest land are both important in managing for a broad-ranging animal, such as the wolf (Mladenoff et al. 1995). However, habitat size can be relatively small and still maintain many plants and small, non-migratory animals. In the Midwest, Temple and Cary (1988) recommend areas of forest habitat should be large enough to allow for a 200 m edge buffer for interior forest bird populations. Keller et al. (1993) reported that forest tracts wider than 100 m had more neotropical migrant species and the birds continued to increase in numbers but much more gradually in forests wider than 200 m. Robbins et al. (1989) studied birds in the Mid-Atlantic United States and found that several species were not detected in forests less than 10 ha in area. Friesen et al. (1995) studied woodland sizes relative to neotropical bird abundance and found 4 ha woodlots without any nearby houses had on average more bird community abundance than 25 ha woodlots in urban areas. Small areas may be sufficient to maintain vegetation communities. Levenson (1981:38) estimated that dry, midwestern forest areas must be larger than 3.8 ha to sustain forest-interior vegetation communities. Watkins et al. (2003) examined the distribution of understory plants and relationships to unpaved forest roads in a northern hardwood forest landscape in the Chequamegon National Forest, Wisconsin and found that species richness of vegetation was similar to forest interior levels within 5 m from the road. Chalfoun et al. (2002) reported that forest edges in agricultural landscapes may attract a greater numbers of nest predator species than forest interiors, but found that forest vegetation structure was very similar between edge and interior, suggesting that differences in predator abundance and species richness were not driven by variation in habitat structure. Lehtinen et al. (1999) reported the species richness of 10 amphibians was lower with greater wetland isolation and road density in urban and agricultural regions of central and southwestern Minnesota. The reduction in amphibians was likely because the majority of adult amphibians travel no further than 200 or 300 m from a home pond to foraging or over-wintering sites (Rothermel et al., 2002). Gibbs (2000) suggests wetlands greater than 1 acre (0.4 ha) are likely the minimum size to sustain the wetland organisms. In addition to maintaining a wetland of a minimum size the habitat that surrounds a wetland is important. Shisler et al. (1987) suggests vegetation widths of 30 and 45 meters around wetlands is important for wildlife, especially in urban environments. The RSEA used 16 hectares as the minimum size for tall grasslands with a minimum width of 90 meters, because large patches of grassland habitat have been recommended for grassland birds in North America (Winter et al. 2006). Density of three grassland bird species in North Dakota and Minnesota was influenced by size of the habitat, landscape, region, and local vegetation structure (Winter et al. 2006).
Next Steps
- Future enhancements
- The quality of the data is good with consistent coverage across the state. The index could be improved by including the Biodiversity rankings for the sections of Minnesota that are incomplete. Greater detailed habitat cover could produce more accurate results, but given the size and complexity of the computations, would only be beneficial as greater computer power becomes available. The scoring process could be improved with a baseline value for habitat quality in each watershed. A potential baseline value could be generated using circa 1895 land cover dataset (Marschner data) to determine a more accurate maximum quality value for comparison. This value would be used to more accurately score the current condition based on an attainable historical condition. An aquatic habitat quality component could be added to this index to offset the terrestrial fragmentation in the current index, but data are not available at present to calculate an aquatic habitat quality index for lakes.