How susceptible are the soils in each watershed to erosion?

Why is this important for geomorphology?
The movement of soil due to erosion is a natural on-going process across all landscapes. Soil is moved by water, wind and human activity. Different soil types are more vulnerable to being transported and this has influenced the variety of landforms seen across Minnesota today. Soil movement continues to change the shape of the landscape and can become problematic when excessive erosion removes productive soils, deposits soil in streams, changes the shape of valleys or leads to mass wasting or landslides.Sediment is a prevalent water pollutant worldwide (Vorosmarty et al. 2010), and in much of Minnesota (Verry, 1986; Allan et al., 1997; Montgomery and Buffington, 1998; Stewart et al, 2001; Wardrop et al., 2005). Sediment comes primarily from three sources; upland areas, streambanks, and sediments stored in river channels from past erosion. Whatever the source of sediment, the amount and timing of sediment input can alter the shape of a stream channel.Soil Erodibility Health Scores
Creating the Index
- Input Data
- Calculating the index
- This index combines the inherent erodibility of a soil type (known as K-factor); with the position of the soil on the landscape (slope) to rank each watershed by its erosion potential. Soil types vary in their erodibility depending on their texture, structure, and other physical properties. Additionally, erosion potential increases with slope, in a non-linear fashion. The soil erodibility (K-factor) value from the most detailed available soils data (SSURGO) was modified by incorporating a slope factor. The percent slope was calculated from the 10-meter national grid DEM dataset. The percent slope was then used to create slope classes for use as a multiplier for the K-factor. Many studies demonstrate a linear or greater increase in soil erosion as slope increases (e.g., Fox and Bryan, 2000).
The K-factor for the soils is updated using the following table of slope classes:
0-1% = 1 1-2% = 2 2-3% = 3 3%+ = 4K-Factor0.02 0.05 0.10 0.15 0.17 0.20 0.24 0.28 0.32 0.37 0.430.491.00 0.02 0.05 0.10 0.15 0.17 0.20 0.24 0.28 0.32 0.37 0.430.492.00 0.04 0.10 0.20 0.30 0.34 0.400.480.560.640.740.860.983.00 0.06 0.15 0.30 0.450.510.600.720.840.961.111.291.474.00 0.08 0.20 0.400.600.680.800.961.121.281.481.721.96Score = Mean Erodible Value for Watershed Land Area
where: "Mean Erodible Value" is mean slope-weighted K-Factor
"Watershed Land Area" is watershed area without lakes area
The slope-scaled K-value were then averaged for each watershed. The average values were then scored linearly from 0-100.
Index Results
- Interpretation of results
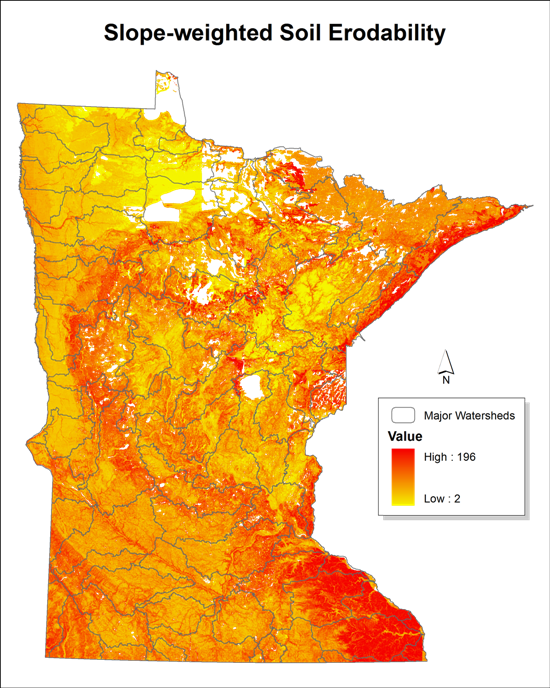
- Erosion potential is highest in the steepest, agricultural lands, with highest values observed in the extreme southwest and south central portion of Minnesota. The Southwest is susceptible to erosion due to a concentration of soils with moderate erosion potential with a relatively high frequency on steep slopes, whereas the west central region is susceptible due to large areas of soils with high soil K-factors.Erosion potential in watersheds varies with the combination of inherent soil erodibility and steepness. Areas of high soil K-factors on steep slopes are found in southeast Minnesota and in northeast Minnesota, resulting in moderate to high erosion potential. Areas in the south-central and southwestern portion of the state have various mixes of highly erodible soils and steep slopes but erodibility scores are relatively high. There are highly erodible soils in the Red River valley, but the scores for this agricultural landscape are moderate to high due the low slope throughout the region.The results at the catchment scale reveal patterns within major watersheds. For example, the watersheds in eastern Minnesota are increasingly vulnerable to erosion as you move from west to east. This likely reflects the steep bluffs along the Mississippi River and near Lake Superior; as well as thin soils over bedrock in the north east.Land use is not factored into this index value and this index does not reflect current levels of erosion. Rather this index is an indication of how inherently vulnerable the landscape is to erosion.
- Relationship to other health components
- Water qualitySoil erodibility is directly related to water quality because sediment is a common water pollutant. Increased soil erosion and sediment transport to streams increases turbidity and fine sediment delivery, which impairs water quality.
Connectivity
There are several ways that soil erosion can impact connectivity. For example, the transfer of energy, nutrients and matter between the stream and streambed within the hyporheic zone (the zone below the water streambed interface) can be altered by the deposition of sediment over the bed. Also, lateral hydrologic connectivity can be affected if deposition of eroded soils creates barriers that limit access to the floodplain.Hydrology
The erosive power of flowing water is altered by the amount of sediment that is transported. If a river deposits its sediment, such as behind a dam, the sediment free or “sediment hungry” water below the dam will have more power and will erode sediment from the stream banks or stream bed to reach equilibrium termed degradation. Too much sediment entering a stream from upstream or overland sources will overwhelm flow capacity so will fill the channel, causing the stream to become shallower and wider, termed aggradation.Biology
Sediment transported in the water or deposited on the streambed affects the abundance and composition of most aquatic organisms, through direct interference with light penetration and limits on primary productivity and through direct changes in habitats for hiding, feeding, and reproduction (Nerbonne and Vondracek, 2001; Wang et al., 2003; Allen, 2004). Fine sediment or total suspended solids (TSS) can clog or erode gill tissues of aquatic organisms at high concentrations, which can lead to death (Newcombe and Jensen 1996).
Supporting Science
- Scientific literature support
- Soil erosion is amply identified as among the most widespread water pollutants, largely due to present or past soil erosion from agriculture and home, bridge, and culvert construction through most of the well-watered eastern half of the continental United States, and particularly for the agricultural Midwest. Many studies have shown significantly higher stream sediment concentrations and turbidity in direct proportion to the amount of annual land cover, or in inverse proportion to forest or perennial landcover (Verry, 1986; Allan et al., 1997; Johnson et al., 1997; Zampella et al., 2007). Fine sediments may lead to mortality of aquatic flora and fauna, bury sand and gravel beds important for spawning, bury allochthonous (land originating) organic inputs, and reduce and degrade habitat for benthic organisms (Graham 1990; Wood and Armitage, 1997).The specific components of the index are supported by their inclusion of the main factors found correlated with high sediment loads, reduced indices of biotic integrity, and measures of physical and biological water impairment, and specifically by the work of Schlosser and Karr (1980, 1981), establishing a link between the soil erodibility factor (K), land use, and percent slope and length with stream sediment, suspended solids, and turbidity in streams in the upper Midwest. These articles indicate a strong relationship between watershed-based measures of erosional potential and stream-sampled sediment and turbidity in agricultural watersheds, and noted the influence of variation in landcover on sediment loadings.
- Confidence in index
- Confidence in these results is high. There are strong theoretical and empirical evidence between the components of the metric and water quality, based on research conducted across the world, in the upper Midwest, and in Minnesota. The index is based on high-quality, current data: soil K-factors on the highest-quality, modern SURGO data sets available for more than 85% of Minnesota; and slope is based on 10-meter data statewide, using the most accurately available slope classification algorithm.
Next Steps
- Future enhancements
- This index does not separate the primary sources of erosion, overland flow and transport, from bank or bed erosion, nor is it sensitive to transport efficiencies both on uplands and in a stream. Areas may have substantial perennial vegetative cover, on moderately or low erodible soils, but significant sediment input from bank erosion. For example, 56% of the sediment delivered to the Blue Earth River, a tributary to the Minnesota River, is from bank erosion (Thoma et al. 2005). This delivery of sediment is particularly true in areas of substantial past erosion and re-deposition, as current geomorphologies are not stable, and streams are re-working sediments to a more stable landscape. Perennial vegetation on streambanks may reduce sediment inputs, but sediment delivery may still be substantial (Nerbonne and Vondracek 2001).The index does not include in-stream transport and remobilization of in-stream sources. High historic rates of sediment production and delivery to streams in many cases have led to large amounts of sediment currently stored within the stream channel. Many streams and rivers are transport limited, in that they receive or generate more sediment each year than they can transport, as there may be significant in-stream sources.The index does not represent transport processes. Sediment must be generated and then transported to water bodies, and may be deposited in the intervening landscape. The index largely reflects sediment generation, and the potential for sediment delivery, but not transport.This index uses slope but does not include wind as a factor in inherent vulnerability. This may underestimate the vulnerability to erosion of western and southwestern Minnesota where the erodible soils are found on areas of low slope. The addition of wind data is a planned enhancement of this index