A monthly electronic newsletter summarizing Minnesota's climate conditions and the resulting impact on water resources. Distributed on the first Thursday of the month.
State Climatology Office - DNR Division of Ecological and Water Resources, St. Paul
distributed: October 5, 2017
What happened in September 2017:
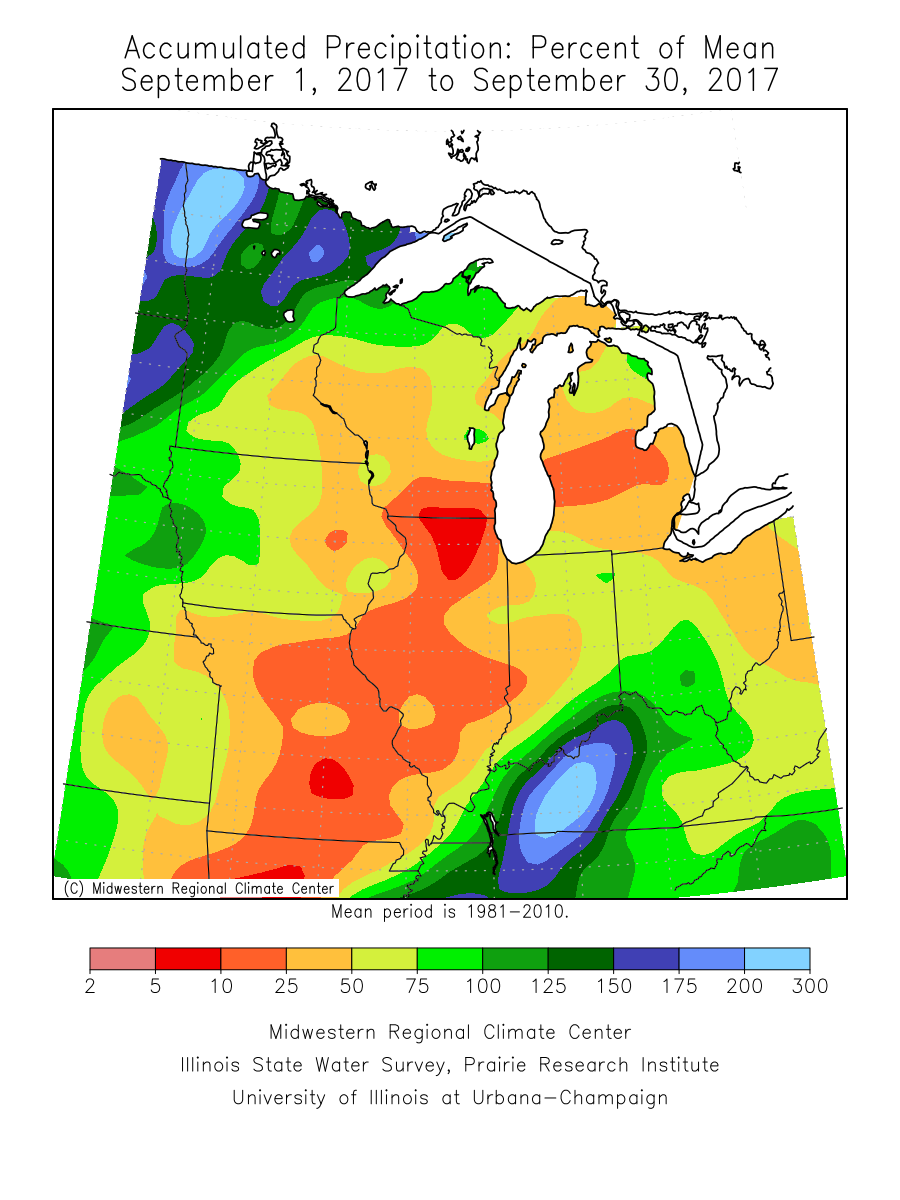
- September 2017 was a month that seemed more like summer than the start to autumn. The preliminary statewide precipitation was 2.86 inches or .42 inches below normal. The state was bisected in a line from Marshall through St. Cloud to Duluth. North and west of this line rainfall was above normal and to the south and east of this line precipitation fell short. The wettest area was in the region that needed it the most, specifically northwestern Minnesota where rainfall was two to three inches above normal. The far southeast continued to desiccate and far southeastern counties were two to three inches short of normal. The driest location was Harmony in Fillmore County. There was only .47 inches for the month or 3.17 inches below normal. On the other end of the spectrum was Camp Norris in Lake of the Woods County with 7.22 inches or 4.28 inches above normal.
[see: September 2017 Precipitation Total Map | September 2017 Precipitation Departure Map | September 2017 Climate Summary Table | September 2017 Percent of Normal Precipitation Map] - September 2017 was a relatively quiet month in terms of severe storms, but there were a few storm episodes of note:
- On Labor Day, a warm and partly sunny day was interrupted by a sharp cold front that ushered in storms and some very gusty winds. No significant damage was reported, but many who were enjoying outdoor activities had to scurry for cover.
[see: September 4, 2017 Labor Day Storm] - You may be surprised to learn that there was a day in September with six tornadoes. On September 20, six weak tornadoes were reported in west central Minnesota. Damage was mostly confined to shingles, siding, and the loss of some grain bins and machine sheds.
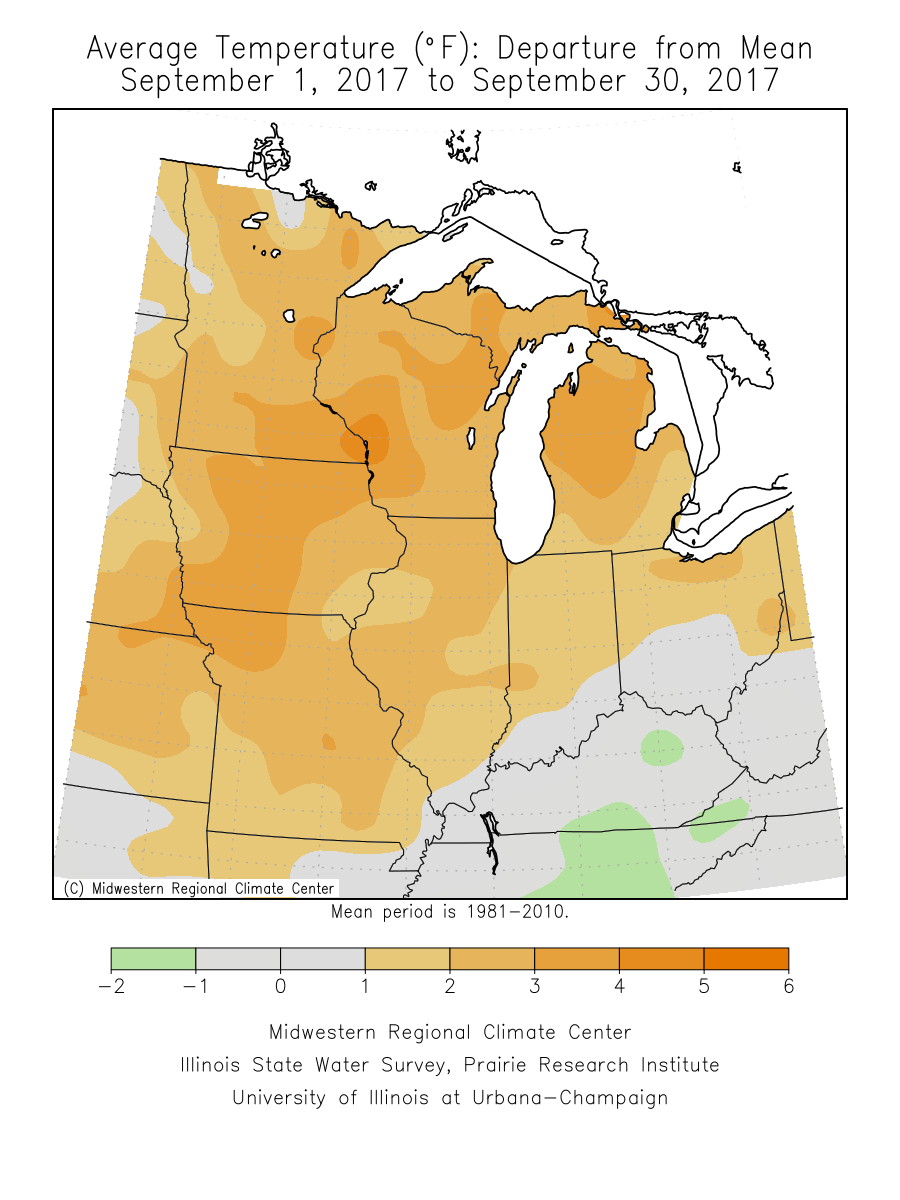
[see: September 19-20, 2017 Severe Weather Event] - The preliminary statewide average for the month was 62.2 degrees or 3.2 degrees above normal. This came on the heels of an August that finished below normal statewide. Farmers eyeing the progress of their crops were pleased with the warm weather. The warmest maximum temperature found was 95 degrees at Marshall on September 23. The coldest temperature of the month was 29 degrees on the 6th at Goodridge in northwest Minnesota and Brimson in northeast Minnesota on Sept 30. September 2017 will be remembered for the heat wave hit the state from September 21-24. The Twin Cities saw three consecutive days of 90 degrees or higher, a record for so late in the season. The dew point temperatures at the Twin Cities was 70 degrees or above for 31 hours. This gave a look and feel of a mid-summer heat spell, especially during the overnight hours. Record high minimum temperatures were set in the Twin Cities on September 22 and 23 with 73 degrees for each night.
[see: September 2017 Climate Summary Table | 2017 September Departure from Normal Temperature Map] | Early Autumn Heat]
Where we stand now:
- Seasonal precipitation totals (April 1 through October 3) ranked above the historical median over much of southwest, central and northeast Minnesota, with a portion of central Minnesota in the 98% for the wettest growing season. Northwest and far southeast Minnesota is near to below normal ranking. A few areas in far southeast Minnesota and in far northwest and parts of north central are well below the median.
[see: Seasonal Precipitation Ranking Map] - The U. S. Drought Monitor map released on October 3, depicts a very small area of far southeast Minnesota in the Severe Drought category. Two percent of the state is in the Moderate Drought category, in north central Minnesota and a small part of southeast Minnesota. This is a bit of a reduction from last week. 11 percent of the state is Abnormally Dry. Last year at this time there was no drought designation in Minnesota. The U.S. Drought Monitor index is a blend of science and subjectivity where drought categories (Moderate, Severe, etc.) are based on several indicators.
[see: Drought Conditions Overview] - The U.S. Geological Survey reports that stream discharge values are much above normal to high across large sections of southwest, central and northeast Minnesota. Normal to above normal flows are in the north central and southeast. The Minnesota River at Montevideo was at the 99% for the date when compared to past stream flow measurements on October 5.
[see: USGS Stream Flow Conditions] - Water levels on most Minnesota lakes vary depending on lake and location in the state. Mille Lacs was above the median lake level for September. On October 4, Minnetonka was at 929.11 with 150 cfs flowing through Grays Bay Dam. White Bear Lake was at 923.10 feet on October 5, a rise of .46 feet from one year ago and a rise of 4.26 feet from the record low of 918.84 measured January 10, 2013. Rainy and Lake of the Woods are in the median range for September and trending higher. Lake Superior was at 603.08 feet on September 29, eleven inches higher than the monthly average for September.
[see: Mille Lacs Lake Water Level | Lake Minnetonka Water Level | White Bear Lake Water Level | Lake of the Woods Control Board Basin Data | Corps of Engineers Great Lakes Water Levels] - The Agricultural Statistics Service on October 2 reports that topsoil moisture across Minnesota is 1 percent Very Short, 5 percent Short, 72 percent Adequate, and 22 percent Surplus. Damp field conditions throughout much of Minnesota left soybean harvest ten days behind the five year average on October 1. Soil moisture levels at Lamberton and Waseca are well above the historical median.
[see: Agricultural Statistics Service Crop Progress and Condition | U. of M. Southwest Research and Outreach Center (Lamberton) | U. of M. Southern Research and Outreach Center (Waseca)] - The potential for wildfires is currently rated by DNR Forestry as Low across Minnesota. Historically, 80 percent of all wildfires in Minnesota occur during April and May.
[see: Fire Danger Rating Map]
Future prospects:
- The October precipitation outlook leans towards above normal precipitation across the entire state of the state. October precipitation normals range from about one-and-a-half inches in northwest Minnesota to about three-and-a-half inches in Cook County. Southern and central Minnesota range by about one-and-three-quarters of an inch in the southwest to about two-and-a-half inches in east central Minnesota.
[see: Climate Prediction Center 30-day Outlook | October Precipitation Normal Map] - The October temperature outlook leans towards above normal temperatures throughout Minnesota for October, with the best chance in the southeast. Normal October high temperatures are in the 60's to start the month, dropping to the low 50's to upper 40's by month's end. Normal lows are in the 40's early in the month, falling to the 30's by late October.
[see: Climate Prediction Center 30-day Outlook | October Temperature Normal Map] - The 90-day temperature outlook for October through December has a continuation of above normal temperatures. The 90-day precipitation outlook for October through December indicates equal chances of below-normal, near-normal, or above-normal conditions across most of Minnesota.
[see: Climate Prediction Center 90-day Outlook] - The National Weather Service produces long-range probabilistic river stage and discharge outlooks for the Red River, Minnesota River, and Mississippi River basins. These products address both high flow and low flow probabilities.
[see: National Weather Service - North Central River Forecast Center]
From the author:
- The Winter Outlook (December-February) from the Climate Prediction Center has equal chances for below, normal and above normal temperatures and precipitation. Basically, a three-sided coin.
[see: Climate Prediction Center December-February Outlook]
Upcoming dates of note:
- October 19: National Weather Service releases 30/90 day temperature and precipitation outlooks
![]() Subscribe to email announcements of the monthly posting of this product.
Subscribe to email announcements of the monthly posting of this product.
Pete Boulay, DNR Climatologist