A monthly electronic newsletter summarizing Minnesota's climate conditions and the resulting impact on water resources.
State Climatology Office - DNR Division of Ecological and Water Resources, St. Paul
distributed: August 7, 2023
What happened in July 2023:
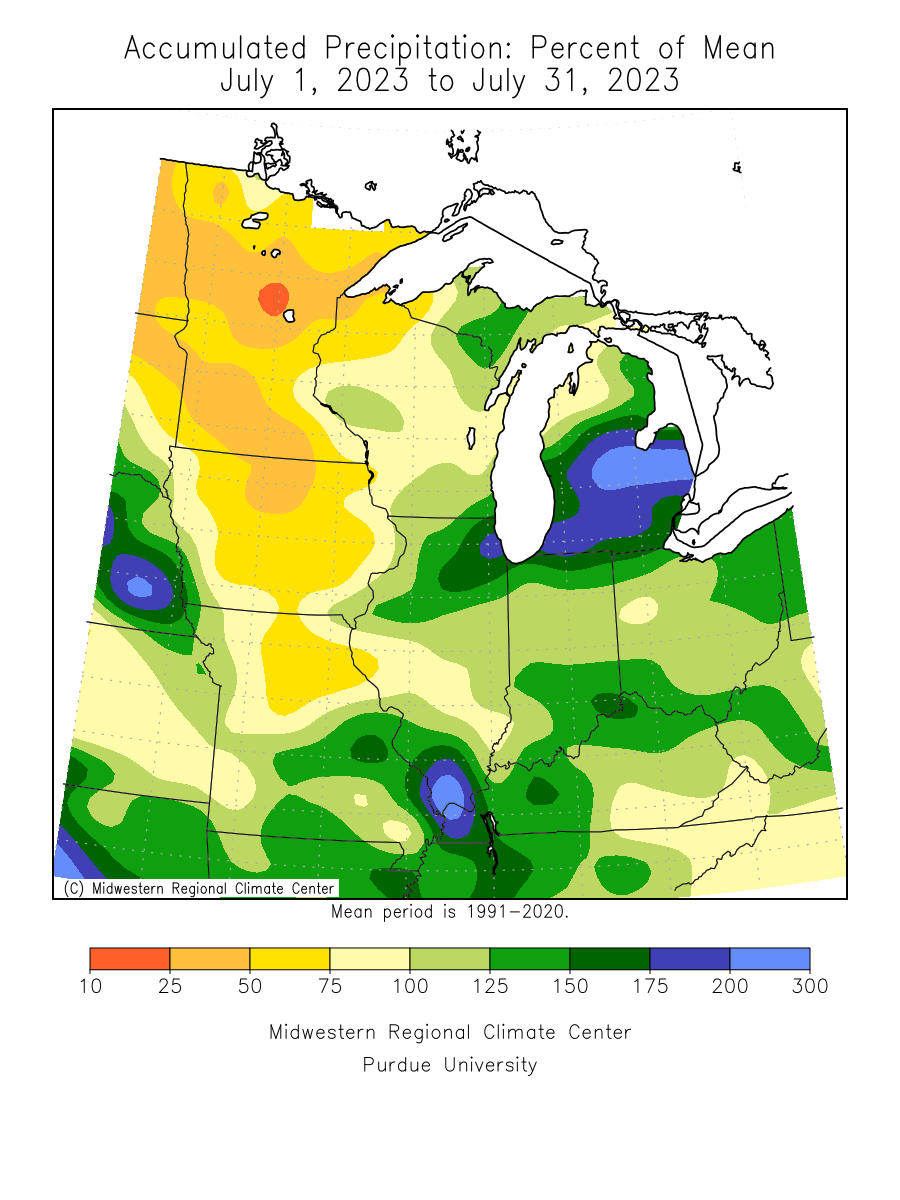
- The bulk of Minnesota saw below-normal precipitation in July 2023, with a few exceptions. The statewide average precipitation was 2.46 inches or 1.62 inches below normal. The wettest areas of the state was west of the Twin Cities and along the Mississippi River downstream of St. Paul. One location that saw above normal precipitation was Hokah in Houston County with 5.61 inches or 1.17 inches above normal. One of the driest locations was at Georgetown in Clay County with .59 or 3.25 inches short of normal. The preliminary statewide average was 2.46 inches or 1.62 inches below normal.
[see: July 2023 Precipitation Total Map | July 2023 Precipitation Departure Map | July 2023 Climate Summary Table | July 2023 Percent of Normal Precipitation Map] - There were a couple active days of severe storms. During the evening of July 13, strong thunderstorms led to many reports of large hail and has the most severe thunderstorm warnings (49) to date. [see: July 13 Severe Storms ]
- A complex of intense thunderstorms with scattered damaging winds and very heavy rains moved across western, central, eastern, and southern Minnesota from the evening of Tuesday July 25th into the morning hours of Wednesday July 26, 2023.
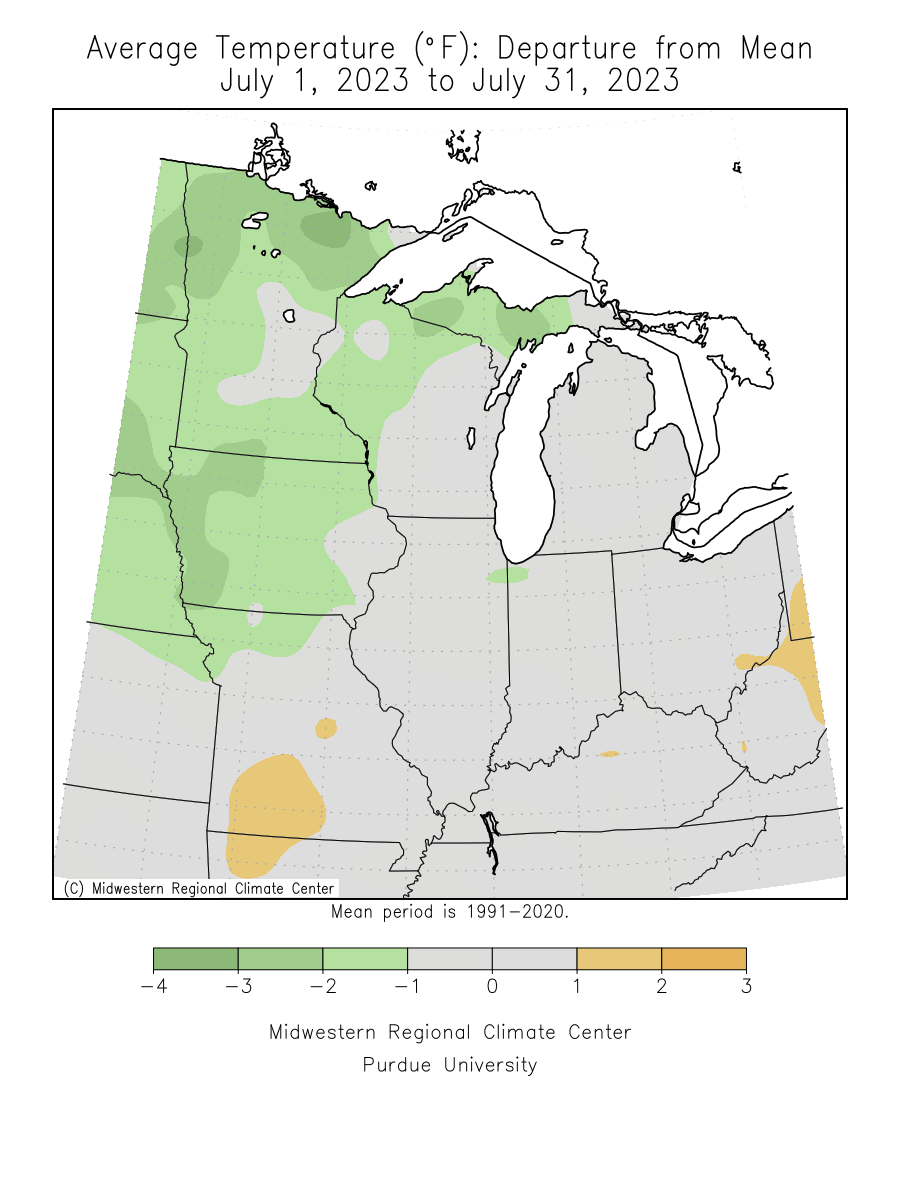
[see: July 25-26 Storms] - The statewide preliminary average temperature for July 2023 was 68.4 degrees, or 1.5 degrees below normal. This broke a streak of Julys that were above normal. The last time there was a Minnesota statewide July average temperature that was below normal was in 2014. The warmest temperature reported in Minnesota for July 2023 was 102 degrees reported at both Canby and Granite Falls in Yellow Medicine County on July 27. The coldest temperature found so far was 33 degrees on July 6th near Goodridge in Pennington County.
[see: July 2023 Climate Summary Table | 2023 July Departure from Normal Temperature Map]
Where we stand now:
- Seasonal precipitation so far (April 1 through August 1) shows that large sections of the state are running below normal. There are a few exceptions, especially in southwest Minnesota from Brown through Renville County where some areas are much above normal. On the other side of the coin, parts of central Minnesota in Sothern Crow Wing and Aitkin County are in the 2nd percentile, or one of the drier April 1-August 1 periods on record.
[see: Seasonal Precipitation Maps] - The U. S. Drought Monitor map released on August 3 depicts 20% of the state in the Abnormally Dry category, 46% in the Moderate Drought category, 31% in the Severe Drought category, and 3% in the Extreme Drought category. One year ago 66% of the state was free of any drought categories. The U.S. Drought Monitor index is a blend of science and subjectivity where drought categories (Moderate, Severe, etc.) are based on several indicators.
[see: Drought Conditions Overview] - The U.S. Geological Survey reports that stream discharge levels vary quite a bit from place to place in Minnesota. The Mississippi River from Grand Rapids to Anoka is Below Normal. The Minnesota Weekly Stream Flow Report has sixteen watersheds have minimum flows, below the annual Q90 or an established protection level. This is up from eleven from the week before. The good news is that a number of watershed in southern Minnesota improved from below normal stream flows to normal stream flows with the rainfall in early August.
[see: Cooperative Stream Gauging | USGS Stream Flow Conditions] - Water levels on Minnesota lakes vary depending on lake and location in the state. On August 7, Minnetonka was at 928.30 feet, exactly the same level as it was this time last year. Gray's Bay Dam closed on July 11. On August 7, White Bear Lake was at 922.56 feet or seven tenths of a foot lower than last year at this time. Rainy Lake is in the normal band for early August lake level. Lake of the Woods continues a slow fall and is below the normal band for early August. Lake Superior was forecasted to be at 602.62 feet on August 4, six inches above the long term monthly average and one inch higher than it was a year ago at this time. The lake level in Superior is forecast to stay unchanged over the next month.
[see: Lake Minnetonka Water Level | White Bear Lake Water Level | Lake of the Woods Control Board Basin Data | Corps of Engineers Great Lakes Water Levels] - The Agricultural Statistics Service on August 7 reports that topsoil moisture across Minnesota is 25 percent Very Short, 43 percent Short, 32 percent Adequate, and 0 percent Surplus. Available soil water at Lamberton on August 1 was 4.41 inches, just below the historical average of 4.56 inches.
[see: Agricultural Statistics Service Crop Progress and Condition | U. of M. Southwest Research & Outreach Center (Lamberton)] - The potential for wildfires rated by DNR Forestry on August 7, as Low across much of the south, east central and part of north central Minnesota. Moderate potential exists over the northwest, west central and central Minnesota and in the northeast.. Historically, 80 percent of all wildfires in Minnesota occur during April and May.
[see: Fire Danger Rating Map]
Future prospects:
- The August precipitation outlook has equal chances for above, normal and below normal precipitation over all but the far southwest where there is a slight tilt for above normal precipitation. August precipitation normals range from about two-and-a-half inches in northwest Minnesota to about five inches in southeastern counties. The August temperature outlook has equal chances for above, normal and below normal temperatures for the entire state. Normal August high temperatures are around 80 degrees to start the month, dropping to the mid-70s by month's end. Normal lows are around 60 degrees early in the month, falling to the mid-50s by late August.
[see: Climate Prediction Center 30-day Outlook | August Temperature Normal Map] - The 90-day precipitation outlook for August through October indicates equal chances for above, normal and below normal precipitation over the entire state. The August through October temperature projection also has equal chances for above, normal and below normal temperatures over the entire state, except perhaps a small area along the border of Iowa in southwest Minnesota, where there is a slight tilt to below normal temperatures.
[see: Climate Prediction Center 90-day Outlook] - The National Weather Service produces long-range probabilistic river stage and discharge outlooks for the Red River, Minnesota River, and Mississippi River basins. These products address both high flow and low flow probabilities.
[see: National Weather Service - North Central River Forecast Center]
From the author:
- For the third year in a row, a substantial drought has returned to Minnesota. From June 1 to August 6, the preliminary statewide departure from normal is 4.02 inches. The statewide total of 5.44 inches is only about 58% of normal. The winter of 2022-23 really helped to east the drought of 2022. What are the chances of a repeat this winter? After three consecutive winters of La Niña, El Niño will be present this winter. What does the Climate Prediction Center have in their outlooks for the winter of 2023-24? In general it appears to be a warm and relatively dry winter. There is a fairly strong tendency for above normal temperatures and a slight tilt to below normal precipitation over the north half of Minnesota. [see: Climate Prediction Center Dec 22-Feb 23]
Upcoming dates of note:
- August 17: National Weather Service releases 30/90 day temperature and precipitation outlooks
![]() Subscribe to email announcements of the monthly posting of this product.
Subscribe to email announcements of the monthly posting of this product.