A monthly electronic newsletter summarizing Minnesota's climate conditions and the resulting impact on water resources.
State Climatology Office - DNR Division of Ecological and Water Resources, St. Paul
distributed: August 7, 2025
What happened in July 2025:
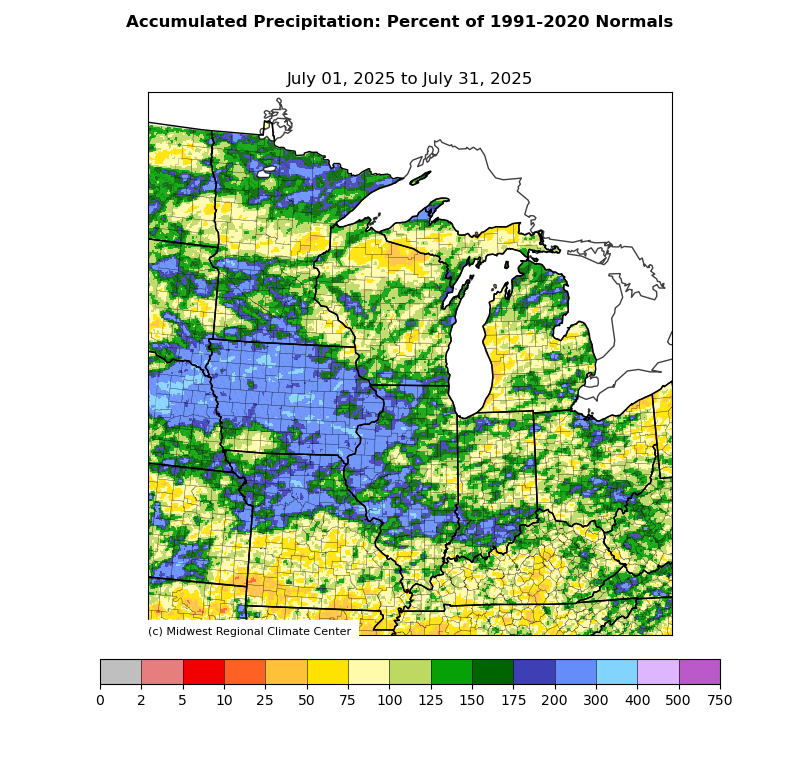
- The bulk of Minnesota saw above normal precipitation in July 2025, with a few exceptions. The preliminary statewide average precipitation was 5.15 inches or 1.09 inches above normal. Pockets of the state were quite wet, especially in south central, central and northeast Minnesota. The wettest location found so far was Sherburn in Martin County with 11.36 inches or 7.31 inches above normal. There were a few areas that the thunderstorms missed in the state and one of the driest locations was Sandstone in Pine County with 2.28 inches or 3.27 inches below normal.
[see: July 2025 Precipitation Total Map | July 2025 Climate Summary Table | July 2025 Percent of Normal Precipitation Map] - July 2025 continued the stormy pattern from June. There were three main storm events. The first came with a series of small disturbances interacting with a very humid air mass led to multiple bouts of thunderstorms and heavy rain, affecting different parts of Minnesota from Monday July 21st through very early on Thursday July 24th, 2025. [see: Heavy Rain and High Humidity, July 21-24, 2025 ]
- The next event was part one of a two-day event of storminess that began on July 27. Heavy thunderstorms produced large hail, gusty winds, and torrential downpours across all but northwestern Minnesota, with localized major flooding around Morris. Storms redeveloped in the evening and swept across the Twin Cities, downing trees and knocking out power to about 85,000 customers. Most areas in Minnesota south of I-94 received a half-inch of rain or more, with about half of that area receiving 1-2 inches. By far the heaviest rainfall was in the flooded areas of west-central Minnesota, particularly in Stevens and eastern Big Stone counties, where observers reported totals of 5-6 inches.
[see: Severe Thunderstorms and Flooding, July 27-28, 2025] - The final event of the month was another round of storms, some of which fell over the same spots as the night before. Intense thunderstorms brought strong winds and heavy rains to central and southern Minnesota on Monday July 28 into very early July 29, 2025. The storms produced wind damage to trees and power lines, as well as additional flooding in parts of western Minnesota already hit hard by excessive rainfall.
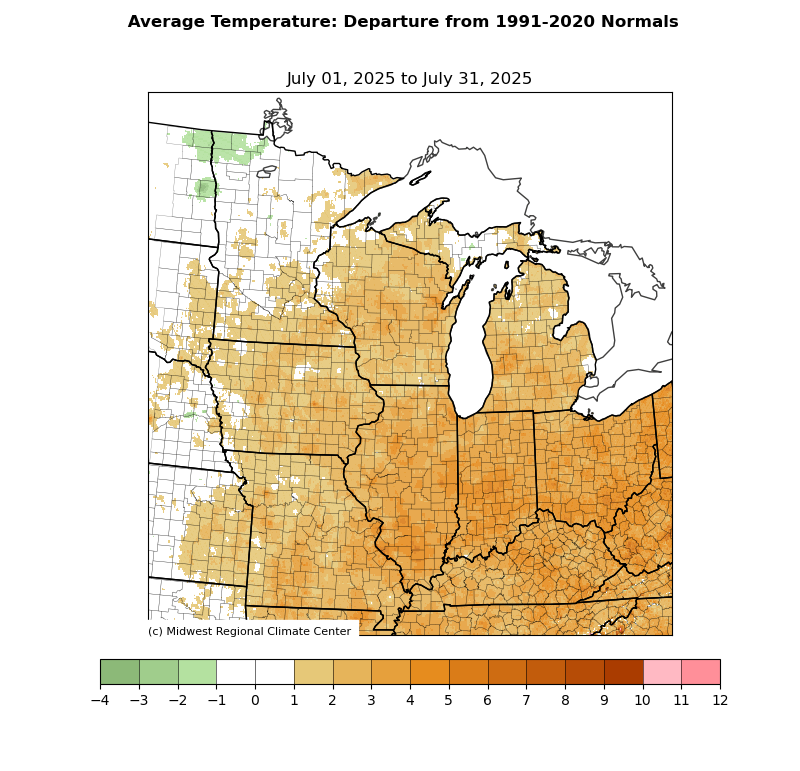
[see: Another Severe Weather Outbreak, July 28-29, 2025] - The statewide preliminary average temperature for July 2025 was 71.1 degrees, or 1.1 degrees above normal. July 2024 was very close to normal. The warmest temperature reported in Minnesota for July 2025 was 96 degrees reported at Marshall on July 4. The coldest temperature found so far was 38 degrees on July 31st near Celena in St. Louis County
[see: July 2025 Climate Summary Table | 2025 July Departure from Normal Temperature Map]
Where we stand now:
- Seasonal precipitation so far (April 1 through August 5) shows that large sections of the state are running very close to normal. There are a few exceptions, on the high side in west central Minnesota some areas are up to 150% of normal and on the low side in far northwestern Minnesota some areas are in the 40-60% of normal range.
[see: Seasonal Precipitation Maps] - The U. S. Drought Monitor map released on July 31 depicts 5% of the state in the Abnormally Dry category and 2.4% in the Moderate Drought category. One year ago the entire state was free of any drought categories. The U.S. Drought Monitor index is a blend of science and subjectivity where drought categories (Moderate, Severe, etc.) are based on several indicators.
[see: Drought Conditions Overview] - The U.S. Geological Survey reports that stream discharge levels are generally above normal to much above normal. This includes the Minnesota, Red River of the North, and the Mississippi. The only area with some below normal stream flow is in Pine County and just across the border in Wisconsin the St. Croix River is much below normal.
[see: Cooperative Stream Gauging | USGS Stream Flow Conditions] - Water levels on Minnesota lakes vary depending on lake and location in the state. On August 5, Mille Lacs was at 11.06 feet, about a half a foot lower than this time last year. Minnetonka was at 929.39 feet on August 4 with 75cfs flowing though Greys Bay Dam. The dam has been letting water out all summer. White Bear Lake was at 923.19, on August 5 fairly close to the level it was one year ago at this time. Rainy Lake is in the normal band for early August lake level. Lake of the Woods has stabilized and is just below the median band for early August. Lake Superior was forecasted to be at 601.97 feet on August 4, two tenths of a foot below the long term monthly average.
[see: Mille Lacs Lake Water Level | Lake Minnetonka Water Level | White Bear Lake Water Level | Lake of the Woods Control Board Basin Data | Corps of Engineers Great Lakes Water Levels] - The Agricultural Statistics Service on August 7 reports that topsoil moisture across Minnesota is 0 percent Very Short, 6 percent Short, 73 percent Adequate, and 21 percent Surplus. Available soil water at Lamberton on August 1 was 6.02 inches, about an inch and a half above the historical average of 4.59 inches.
[see: Agricultural Statistics Service Crop Progress and Condition | U. of M. Southwest Research & Outreach Center (Lamberton)] - The potential for wildfires rated by DNR Forestry on August 5, as Low across all but the area around Upper and Lower Red Lake. High Risk exists over this area. Historically, 80 percent of all wildfires in Minnesota occur during April and May.
[see: Fire Danger Rating Map]
Future prospects:
- The August precipitation outlook has equal chances for above, normal and below normal precipitation over not only Minnesota, but surrounding states as well. August precipitation normals range from about two-and-a-half inches in northwest Minnesota to about five inches in southeastern counties. The August temperature outlook has equal chances for above, normal and below normal temperatures for the southern half of the state, white there is a slight tilt for above normal temperatures in the north. Normal August high temperatures are around 80 degrees to start the month, dropping to the mid-70s by month's end. Normal lows are around 60 degrees early in the month, falling to the mid-50s by late August.
[see: Climate Prediction Center 30-day Outlook | August Temperature Normal Map] - The 90-day precipitation outlook for August through October is paring a warm and dry picture for not only Minnesota, but for much of the surrounding area. There is a tilt for warm and dry conditions over the entire state. The August through October temperature projection also has equal chances for above, normal and below normal temperatures over the entire state, except perhaps a small area along the border of Iowa in southwest Minnesota, where there is a slight tilt to below normal temperatures. What does the winter of 2025-26 hold? The preliminary outlook for this winter has equal chances for above normal and below normal temperatures and the same for precipitation. However, looking farther out into March, there is a slight tilt for colder temperatures in the north. The plot thickens.
[see: Climate Prediction Center 90-day Outlook | Meteorological Winter 2025-26] - The National Weather Service produces long-range probabilistic river stage and discharge outlooks for the Red River, Minnesota River, and Mississippi River basins. These products address both high flow and low flow probabilities.
[see: National Weather Service - North Central River Forecast Center]
From the author:
- The annoying aspect of this summer is when there is a break in the heat and humidity and cooler air arrives from Canada, smoke also arrives along the ride. So far, there have been three smoke events this summer. The first one was roughly May 28 to June 3, the next one was July 11-13 and then another episode was July 30 to August 2. The smoke varied with each event with some days had thicker smoke and haze than others. [see: Another Major Smoke Event, July 11-13, 2025]
Upcoming dates of note:
- August 21: National Weather Service releases 30/90 day temperature and precipitation outlooks
![]() Subscribe to email announcements of the monthly posting of this product.
Subscribe to email announcements of the monthly posting of this product.