A monthly electronic newsletter summarizing Minnesota's climate conditions and the resulting impact on water resources.
State Climatology Office - DNR Division of Ecological and Water Resources, St. Paul
distributed: December 14, 2023
What happened in November 2023:
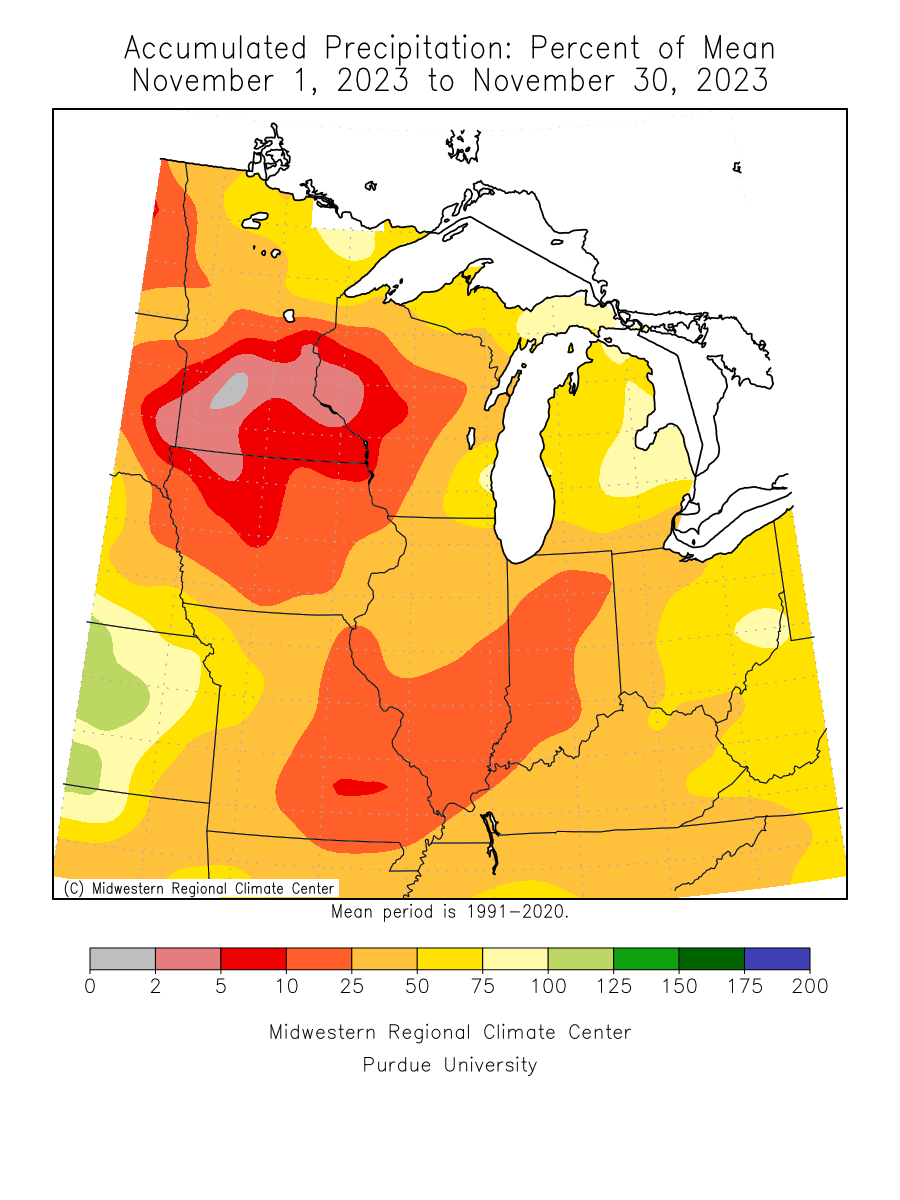
- Minnesota had the 13th driest November back to 1895 and was the driest November since 2011. There was only one event of note, which was a precipitation episode on November 5-6 that dropped a half inch to an inch of precipitation in northeast Minnesota. One of the highest monthly totals found so far is 1.83 inches at Wolf Ridge and the smallest amount was zero at Tracy. The statewide preliminary precipitation total was .32 inches or 1.20 inches below normal.
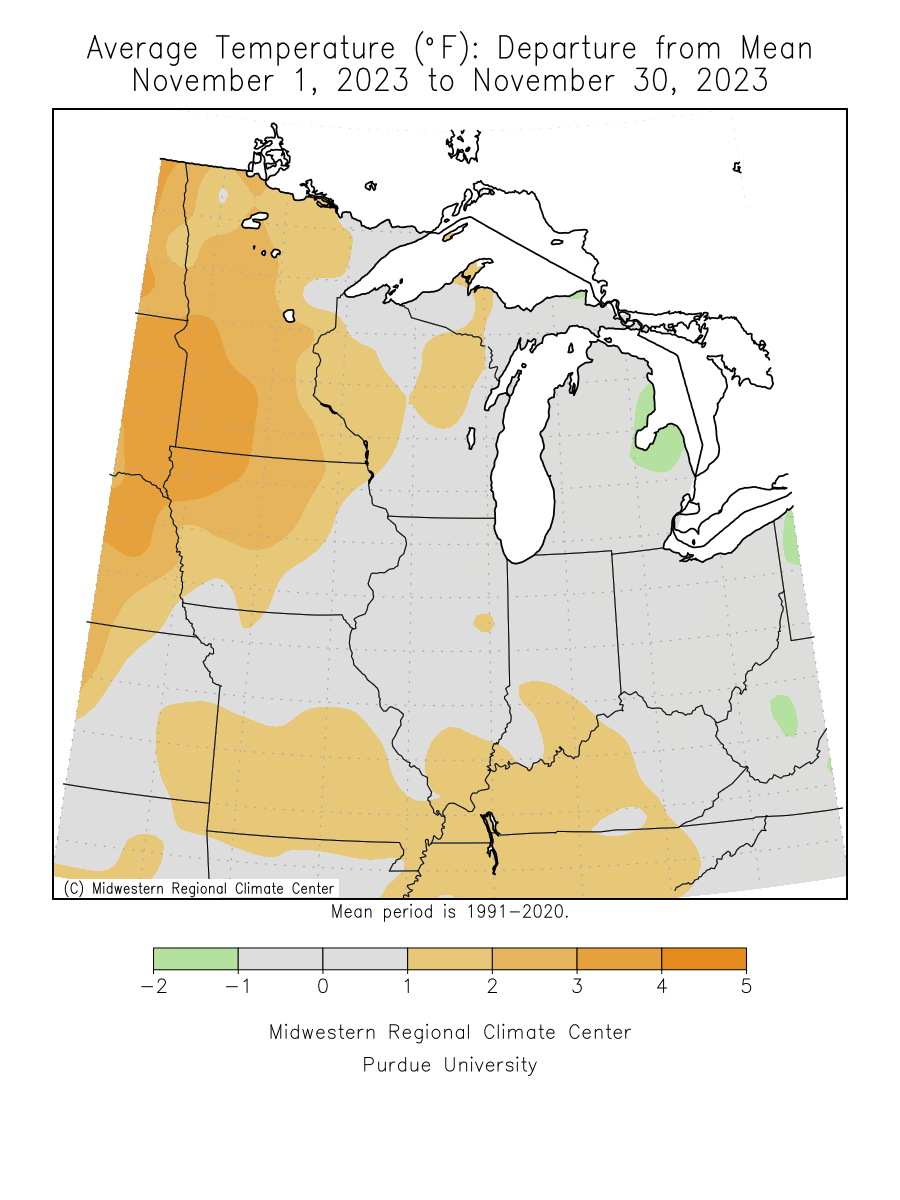
[see: November 2023 Preliminary Precipitation Total Map | November 2023 Precipitation Departure Map | November 2023 Climate Summary Table | November 2023 Percent of Normal Precipitation Map] - Monthly November temperature averages were above normal, with some truly balmy temperatures in the middle of the month. High temperatures on November 16th were in the middle to upper 60s with 69 degrees F at the Twin Cities. The last week of the month had quite a cold snap with temperatures in the single digits or below zero on the 28th. The highest temperature found for the month was 70 degrees at Hastings Dam and the statewide coldest temperature found so far was -11 degrees F near Celina in Northeast MN on the 28th. [see: November 2023 Climate Summary Table | 2023 November Departure from Normal Temperature Map]
- November 14-16, 2023 brought temperatures soaring 20-25 degrees above normal across the state, giving golfers another shot at a tee-time and delaying the winter-coat season. Normal high temperatures for mid-November in Minnesota are in the mid-30s to low 40s, so it was more like early October in the state.
[see: Warm (and Sometimes Windy) November 14-16, 2023]
Where we stand now:
- As of December 14, 2023 there is scant snow on the ground in the state, even in northeast Minnesota. Having a trace on the ground at a location such as International Falls in mid-December is rare and has only happened five times in the last 78 years. The snow drought continues.
[see:NWS Snow Depth Estimation Map | Midwest Regional Climate Center Snow Depth Map| MNDNR Snow Depth Maps] - The U. S. Drought Monitor map released on December 14, depicts 98% of Minnesota with some level of drought designation. About 53% of the state was Abnormally Dry, 27% of the state was in Moderate Drought conditions. Severe Drought is over 18% of the state. Extreme Drought is just under .3% of the state in the southeast along the Iowa border. The U.S. Drought Monitor index is a blend of science and subjectivity where drought categories (Moderate, Severe, etc.) are based on several indicators.
[see: Drought Conditions Overview] - Ice is affecting many streams across Minnesota. In general, for the areas that still have some open water, such as on the Minnesota River and the Mississippi River, the U.S. Geological Survey reports that stream discharge values are below normal to near normal.
[see: USGS Stream Flow Conditions] - Water levels on most Minnesota lakes vary depending on lake and location in the state. Many lakes froze over with the cold snap at the end of November, but have struggled to build good quality ice, especially with the warm conditions during the first half of December. The USGS water level gauge at Mille Lacs on December 13 had a level of 10.43 feet; about .32 feet lower than the median and just below the 25th percentile of 10.45 feet. The level on Lake Minnetonka on December 13 was 928.34 feet, exactly one foot higher than this time last year. White Bear Lake was at 922.04 on December 13. The current level of White Bear Lake is .36 feet lower than last year at this time. The Lake level on Rainy Lake is in the normal band and Lake of the Woods is in the low end of the median range. Lake Superior has been falling this autumn, and had a forecast level of 601.57 feet on December 8, eight inches lower than the long term median and eight inches lower than early December 2022.
[see: Mille Lacs Lake Water Level | Lake Minnetonka Water Level | White Bear Lake Water Level | Lake of the Woods Control Board Basin Data | Corps of Engineers Great Lakes Water Levels] - In their final report for the season, the Agricultural Statistics Service on November 29 reported that topsoil moisture across Minnesota is 9 percent Very Short, 27 percent Short, 60 percent Adequate, and 2 percent Surplus. This is much drier than this time last year when topsoil moisture was 13 percent Short to Very Short. Corn for grain harvest was 98% completed by November 20, on par with 2022 and ahead of the five year average. Soil moisture levels at Lamberton on November 15 showed a soil moisture surplus going into freeze-up.
[see: Agricultural Statistics Service Crop Progress and Condition | U. of M. Southwest Research and Outreach Center (Lamberton) | U. of M. Southern Research and Outreach Center (Waseca)] - Frost depths are very shallow across the state. On December 14, most places across central and southern Minnesota have frost depths of four inches or less under sod. Much of the frost that formed at the end of November has thawed out. Frost depths are a little deeper in the north from about three inches to a foot.
[see: National Weather Service Frost Depth Data | National Weather Service Soil Temperature Data - The potential for wildfires on December 8, 2023 is currently rated by DNR Forestry as Low across northern Minnesota, Moderate in east central and southeast Minnesota, and High across southwest and south central parts of the state. The potential for wildfires is elevated due to the non-existent snow cover. Historically, 80 percent of all wildfires in Minnesota occur during April and May.
[see: Fire Danger Rating Map]
Future prospects:
- The December precipitation outlook that was released on November 30 has most of Minnesota with a tendency for below normal precipitation. The exception is the south that tilts more into the normal category.
[see: Climate Prediction Center 30-day Outlook | December Precipitation Normal Map] - In a complete opposite from a year ago, the December temperature trend (according to the Climate Prediction Center) has a fairly strong tendency for above normal temperatures across the state especially in the northwest. Normal December high temperatures are in the upper 20's to low 30's to start the month, dropping to the low to mid 20's by month's end. Normal lows are in the teens early in the month, falling to single digits by late December.
[see: Climate Prediction Center 30-day Outlook | December Temperature Normal Map] - The 90-day temperature outlook for December through February has a tendency for above normal temperatures across the state. The 90-day precipitation outlook for December through February indicates a tendency for below normal precipitation across the north, with the rest of the state seeing equal chances for above, below and normal precipitation.
[see: Climate Prediction Center 90-day Outlook] - The National Weather Service produces long-range probabilistic river stage and discharge outlooks for the Red River, Minnesota River, and Mississippi River basins. These products address both high flow and low flow probabilities.
[see: National Weather Service - North Central River Forecast Center]
From the author:
- Strong El Niño conditions are here and are forecast to persist into early 2024. What does this mean for the winter? In Minnesota, El Niño conditions have tended to produce mild winters with less snow than average. The 25 El Niño winters since 1950 averaged 1.8 degrees F warmer on a statewide basis than non-El Niño winters, and have produced an average of 22% less snow (12.7 inches) in the Twin Cities. The warmest December-through-February on record in Minnesota came during the very strong 1997-98 El Niño episode. The very strong events in 2015-16 and 1982-83; the strong El Niño in 1991-92; and the moderate one in 1986-87, also are associated with winters that are among Minnesota's 10 warmest on record. The moral of the story is that El Niño tends to yield mild and low-snow winters, but extremely cold and extremely snowy exceptions are always just an Arctic cold front away in Minnesota! [see: "El Niño" is Coming. What Might That Mean for Minnesota's Weather?]
Upcoming dates of note:
- December 21: National Weather Service releases 30/90 day temperature and precipitation outlooks
![]() Subscribe to email announcements of the monthly posting of this product.
Subscribe to email announcements of the monthly posting of this product.
Pete Boulay, DNR Climatologist