A monthly electronic newsletter summarizing Minnesota's climate conditions and the resulting impact on water resources.
State Climatology Office - DNR Division of Ecological and Water Resources, St. Paul
distributed: December 8, 2025
What happened in November 2025:
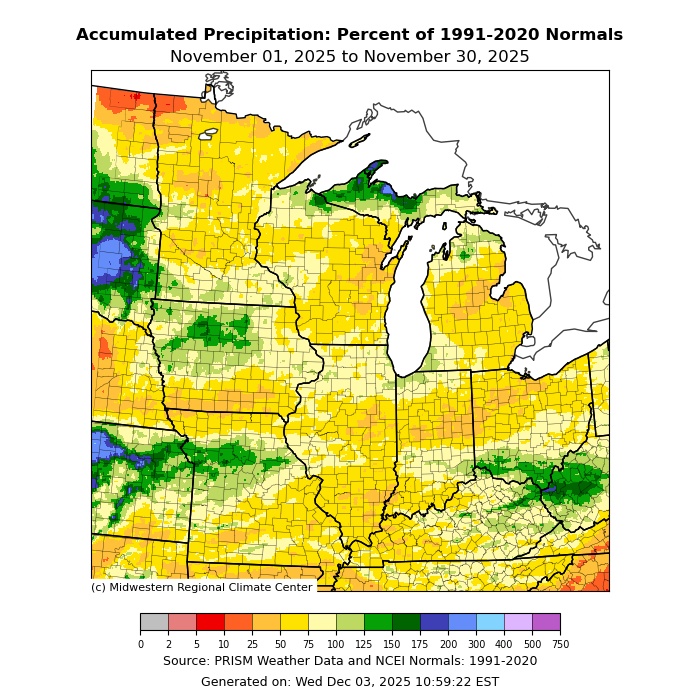
- November was generally a dry month in the state, especially during the first three weeks. A couple rain and snow events swept across the state over the final week to help lessen the precipitation deficit. Statewide precipitation totals were generally about a half to an inch below normal for the month, despite the last-minute flurry of activity. The highest monthly precipitation as of early December was at Winona Dam in southeast Minnesota with 2.60 inches, or .75 inches above normal. One of the drier locations was Winnibigoshish Dam in north central Minnesota with .20 inches, or 1.29 inches below normal.
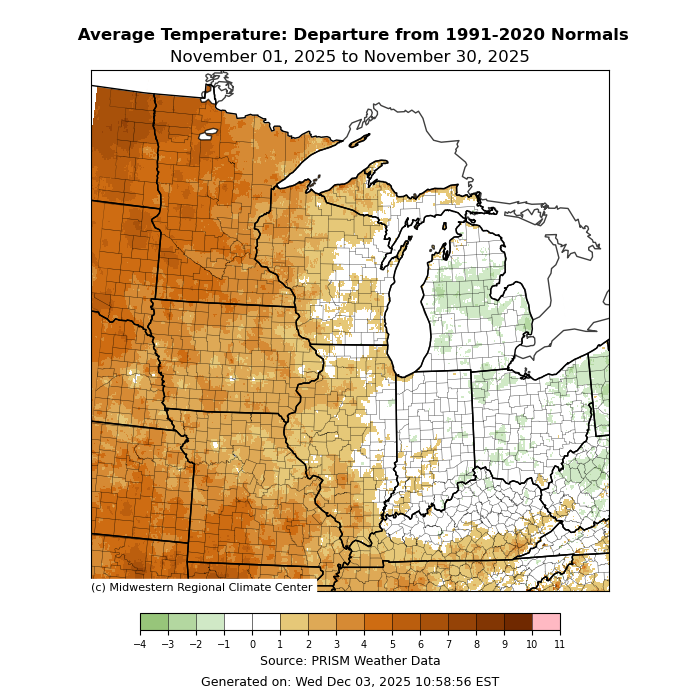
[see: November 2025 Preliminary Precipitation Total Map | November 2025 Climate Summary Table | November 2025 Percent of Normal Precipitation Map] - Despite the cold finish at the end of the month, November 2025 wound up one to four degrees above normal across the state. The preliminary average statewide temperature is 34.7 degrees F, 3.7 degrees above normal. The highest daily temperature for the November (received as of early December) was 77 degrees F at Granite Falls on the 14th. The lowest temperature was -5 at Madison in Lac qui Parle County. [see: November 2025 Climate Summary Table | 2025 November Departure from Normal Temperature Map]
Where we stand now:
- As of December 5, 2025 much of the state has 4-8 inches of snow cover, with the exception of the northwest part of the state, with only an inch or two. Last year at this time the snow cover was confined to northern Minnesota.
[see:NWS Snow Depth Estimation Map | Midwest Regional Climate Center Snow Depth Map| MNDNR Snow Depth Maps] - The U. S. Drought Monitor map released on December 4 depicts 75% of Minnesota with some level of drought designation. About 45% of the state was Abnormally Dry, 26% of the state was in Moderate Drought conditions, with Severe Drought in 4% of the state. The U.S. Drought Monitor index is a blend of science and subjectivity where drought categories (Moderate, Severe, etc.) are based on several indicators.
[see: Drought Conditions Overview] - Ice is affecting many streams across Minnesota. In general, for the areas that still have some open water, such as the Mississippi River, the U.S. Geological Survey (USGS) reports that stream discharge values are below normal. Royalton and St. Cloud were much below normal on December 5th. At both Grand Rapids and St. Paul, the Mississippi was in the normal range.
[see: USGS Stream Flow Conditions] - Water levels on most Minnesota lakes vary depending on lake and location in the state. Many lakes froze over with the cold snap at the end of November and early December. The USGS water level gauge at Mille Lacs on December 5 had a level of 10.15 feet, about a third of a foot lower than last year at this time and about three-fifths of a foot lower than the median. The level on Lake Minnetonka on December 5 was 928.36 feet, about 17 hundredths of a foot lower than this time last year. White Bear Lake was at 922.82 feet on December 5, four tenths of a foot higher than last year at this time. On December 8, the Lake level on Rainy Lake is in the normal band and Lake of the Woods is in the low end of the median range. Lake Superior had a forecast level of 601.44 feet, or 0.19 feet higher than last year at this time.
[see: Mille Lacs Lake Water Level | Lake Minnetonka Water Level | White Bear Lake Water Level | Lake of the Woods Control Board Basin Data | Corps of Engineers Great Lakes Water Levels] - In their final report for the season, the Agricultural Statistics Service on November 24 reported that topsoil moisture across Minnesota was 3 percent Very Short, 19 percent Short, 74 percent Adequate, and 4 percent Surplus. Harvest was finishing up by the end of November. Soil moisture levels at Lamberton on November 15 were slightly above historical averages.
[see: Agricultural Statistics Service Crop Progress and Condition | U. of M. Southwest Research and Outreach Center (Lamberton) | U. of M. Southern Research and Outreach Center (Waseca)] - Frost depths are fairly shallow across the state as of December 8, generally six inches or less with Lamberton, Long Prairie and Orwell dam reporting zero frost depth. The deepest frost noted at the time of this writing was nine inches at Sandy Lake in Aitkin County.
[see: National Weather Service Frost Depth Data | National Weather Service Soil Temperature Data - The potential for wildfires on December 8, 2025 was rated by DNR Forestry as Low across the entire state. The entire state has at least some snow cover, with 4-8 inches on the ground over much of central and southern Minnesota. Historically, 80 percent of all wildfires in Minnesota occur during April and May.
[see: Fire Danger Rating Map]
Future prospects:
- The December precipitation outlook that was released on November 30 shows equal chances of below, above, and normal precipitation in the south and heightened chances for above normal precipitation in the north.
[see: Climate Prediction Center 30-day Outlook | December Precipitation Normal Map] - The Climate Prediction Center indicated heightened chances for below-normal temperatures across Minnesota and the Upper Midwest during December. In Minnesota, the northwest part of the state has the highest probabilities for cool weather. Through December 8, average temperatures in Minnesota already averaged about eleven degrees below normal. Normal December high temperatures are in the upper 20s to low 30s to start the month, dropping to the low to mid 20s by month's end. Normal lows are in the teens early in the month, falling to single digits by late December.
[see: Climate Prediction Center 30-day Outlook | Temperature Normal Maps] - The 90-day temperature outlook for December through February is similar to the December outlook, with increased probabilities for cool weather statewide, reaching a maximum in northwest Minnesota. The 90-day precipitation outlook for December through February indicates a slightly elevated chance for above-normal precipitation in all but the far southwest part of the state, where there will be equal chances for above and below normal precipitation.
[see: Climate Prediction Center 90-day Outlook] - The National Weather Service produces long-range probabilistic river stage and discharge outlooks for the Red River, Minnesota River, and Mississippi River basins. These products address both high flow and low flow probabilities. As of this writing, no widespread flooding has been forecast.
[see: National Weather Service - North Central River Forecast Center]
From the author:
- According to the Climate Prediction Center's December 8 El Niño-Southern Oscillation (ENSO) Outlook, the most recent Oceanic Niño Index (ONI) is at -.6 degrees C, below the La Niña threshold of -.5 degrees C. There is a 50% chance of La Niña persisting this winter but weakening by early spring. This condition is influencing the official outlook for January through March 2025, which continues the heightened probabilities of above normal-precipitation and below-normal temperatures across all of Minnesota.
[see: Climate Prediction Center January-March 2025 Outlook]
Upcoming dates of note:
- December 18: National Weather Service releases 30/90 day temperature and precipitation outlooks
![]() Subscribe to email announcements of the monthly posting of this product.
Subscribe to email announcements of the monthly posting of this product.
Pete Boulay, DNR Climatologist