A monthly electronic newsletter summarizing Minnesota's climate conditions and the resulting impact on water resources. Distributed on the first Thursday of the month.State Climatology Office - DNR Division of Ecological and Water Resources, St. Paul
distributed: January 10, 2019
 Subscribe to email announcements of the monthly posting of this product.
distributed: January 10, 2019
What happened in December 2018:
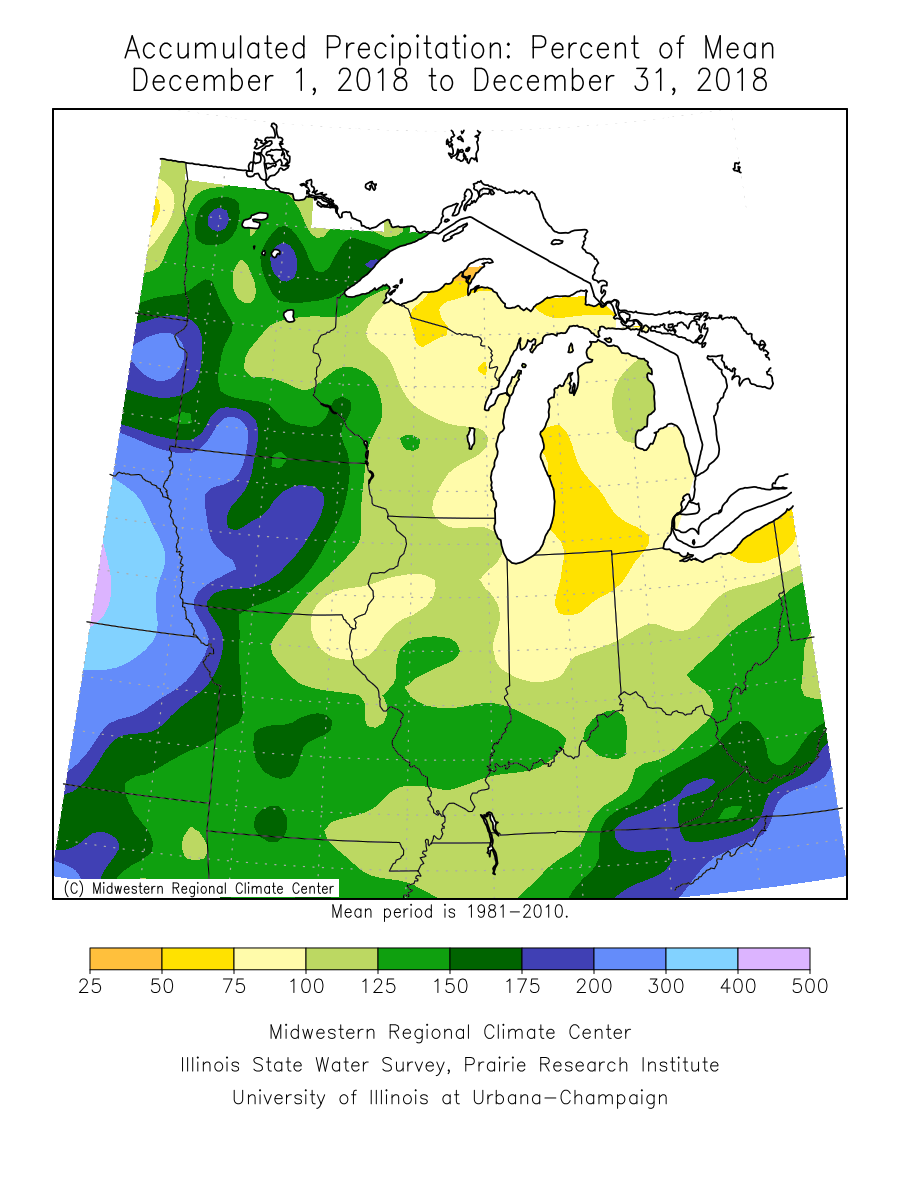
- December was generally above normal for precipitation in the state, with a single event on December 26-28 making up the bulk of the monthly precipitation. In general, precipitation totals were about a half inch above normal, with the wettest locations in southern Minnesota and along the north shore as well. Harmony finished 1.68 inches above normal for a December total of 2.94 inches. The preliminary precipitation total for Harmony is 60.21 inches, which if verified, would the highest annual precipitation total for Minnesota on record.
[see: December 2018 Preliminary Precipitation Total Map | December 2018 Precipitation Departure Map | December 2018 Climate Summary Table | December 2018 Percent of Normal Precipitation Map] - December 2018 had two winter storm episodes of note for the month:
- A winter storm brought heavy snow to southern Minnesota on December 1. For about an hour in the afternoon, the snow was quite intense in the Twin Cities, producing a quick 2 inches and causing very slippery conditions, The snowfall was more substantial to the south with the heaviest snow falling from Highway 14 south to the Iowa border. The snow gradually tapered off in the early morning hours of December 2. The highest snowfall total reported was at St. James with 12 inches. Mankato saw 8 inches and the Rochester International Airport reported 7.1 inches.
[see: Snowstorm: December 1-2, 2018] - After a predominantly mild and uneventful December, a major winter storm brought heavy snow, rain, and wind to Minnesota between December 26th and 28th. The result was 36 hours of precipitation, with heavy snow in the northern half of the state, rain in the far south and southeast, and a mix of snow and rain in between those areas. The highest snowfall total found was 24 inches near Finland in Lake County.
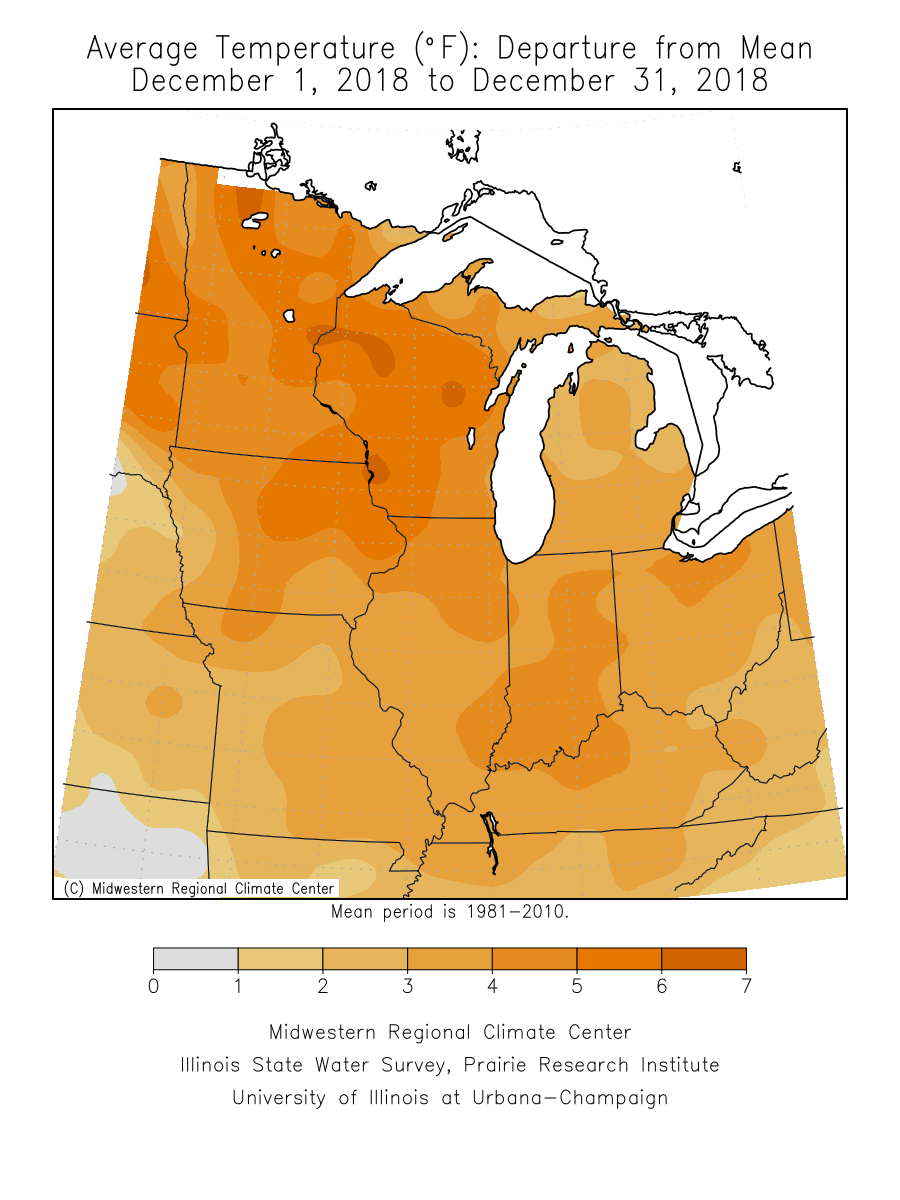
[see: Winter Storm, December 26-28, 2018] - After two months of below normal temperatures, December 2018 was well above normal with a preliminary 5.6 degree temperature departure. The Twin Cities finished 6.1 degrees above normal, with four days in the 40s in the middle of the month. The balmy temperatures eroded the snowpack across the state, especially in the central and south. The coldest temperature found in the state was -31 at Cotton in northeast Minnesota on the 29th and the warmest temperature found was 51 degrees at Brown’s Valley on the 16th.
[see: December 2018 Climate Summary Table | 2018 December Departure from Normal Temperature Map]
Where we stand now:
- Snow depths vary greatly across the state. On January 10, there's bare ground over far southern and southeast Minnesota, to a foot or more over northeast parts of the state. Having this sparse of a snow cover is fairly uncommon for this late in the season and in some areas it is in about a one in ten year occurrence. The last time there was a zero snow depth for January 10 in the Twin Cities was in 2012, and has only happened in nine other years back to 1899.
[see: Weekly Snow Depth and Ranking Maps | NWS Snow Depth Estimation Map | Midwest Regional Climate Center Snow Depth Map] - The U. S. Drought Monitor map released on January 8 depicts two small areas in northwest Minnesota in Abnormally Dry conditions. The U.S. Drought Monitor index is a blend of science and subjectivity where drought categories (Moderate, Severe, etc.) are based on several indicators.
[see: Drought Conditions Overview] - The U.S. Geological Survey reports that stream discharge values(where winter measurements are possible) are much above historical medians for the date on most Minnesota rivers. Most rivers and streams are now impacted by ice.
[see: USGS Stream Flow Conditions] - In their final report of the 2018 growing season (November 25), the Agricultural Statistics Service reported that topsoil moisture across Minnesota was 0 percent Very Short, 1 percent Short, 75 percent Adequate, and 25 percent Surplus.
[see: Agricultural Statistics Service Crop Progress and Condition | U. of M. Southwest Research & Outreach Center (Lamberton) | U. of M. Southern Research & Outreach Center (Waseca)] - The potential for wildfires is currently rated by DNR Forestry as Low across Minnesota.
[see: Fire Danger Rating Map] - Soil frost depths under sod are relatively shallow for early January, ranging from a about a foot or less at Minnesota observing locations in the south and from one to two feet in depth across the north.
[see: National Weather Service Frost Depth Data | MnDOT Road Frost Depths | University of Minnesota - St. Paul Campus Soil Temperatures Under Sod] - Lake ice in was early due to the cold conditions in November, but mild conditions that followed caused some lakes to thaw and to refreeze again. Some lakes stayed frozen, others had multiple freeze-thaw dates. In general lakes first froze over in the middle of November. Some lakes had one if their earlier lake freeze over dates in recent years, such as Budd Lake in Martin County, which froze up on November 13, nearly a month earlier than in 2017. Lake and river ice is never completely safe.
[see: DNR Conservation Officer Reports | 2018 Ice-In Dates] | Median Lake Ice-In Dates]
Future prospects:
- The January precipitation outlook notes a tendency for below-normal conditions in southern Minnesota, with equal chances over the central and north. January precipitation normals range from near one-half inch of liquid equivalent in western Minnesota to just over one inch liquid in eastern sections of the state. The median snow cover at the end of January ranges from near five inches in southwest Minnesota, to over 15 inches on the ground in northeastern Minnesota (greater than 24 inches along the Lake Superior highlands).
[see: Climate Prediction Center 30-day Outlook | January Precipitation Normal Map] - The January temperature outlook has a fairly strong tendency for above normal conditions across Minnesota. Historically, January is Minnesota's coldest month. Normal January high temperatures range the low-teens in the north, to near 20 in the south. Normal January lows range from near minus 10 degrees in the far north, to the single digits above zero in southern Minnesota.
[see: Climate Prediction Center 30-day Outlook | January Temperature Normal Map] - The 90-day precipitation outlook for January through March indicates equal chances for above, below and normal conditions across all of Minnesota. The January through March temperature projection indicates a tendency towards above-normal temperatures, especially in the northeast.
[see: Climate Prediction Center 90-day Outlook] - The National Weather Service produces long-range probabilistic river stage and discharge outlooks for the Red River, Minnesota River, and Mississippi River basins. These products address both high flow and low flow probabilities.
[see: National Weather Service - North Central River Forecast Center]
From the author:
- Season snowfall for the 2018-19 winter is from four to ten inches short in the north, and seven to 14 inches short in the south. It is interesting to note that last snow season (17-18) there was less snowfall through January 9.
Upcoming dates of note:
- January 17: National Weather Service releases 30/90 day temperature and precipitation outlooks
Pete Boulay, DNR Climatologist