A monthly electronic newsletter summarizing Minnesota's climate conditions and the resulting impact on water resources. Distributed on the first Thursday of the month.
State Climatology Office - DNR Division of Ecological and Water Resources, St. Paul
distributed: January 8, 2021
What happened in December 2020:
- December 2020 was a dry month for most places in the state. If it wasn’t for a single weather event right before Christmas much of the state would have had a brown landscape over the holiday. The preliminary average statewide precipitation total was .63 inches or .35 inches below normal. The wettest locations were in north central and northeast Minnesota with International Falls finishing with 1.16 inches or .35 inches above normal. One of the driest locations was in southeast Minnesota where Rochester only saw .20 inches or 1.03 inches below normal. Many places in the state also finished with below normal precipitation total for the year. For 2020, the Twin Cities finished with 29.83 inches or .78 inches below normal. Duluth had only 21.26 inches for the year or 9.70 inches below normal.
[see: December 2020 Preliminary Precipitation Total Map | December 2020 Precipitation Departure Map | December 2020 Climate Summary Table] - December 2020 had one winter storm that stood out for the month.
- One of the most intense winter storms in recent years brought blistering waves of heavy, wind-driven snow to much of Minnesota on December 23rd, creating widespread whiteout conditions, shutting down highways, and damaging holiday light displays across the state.
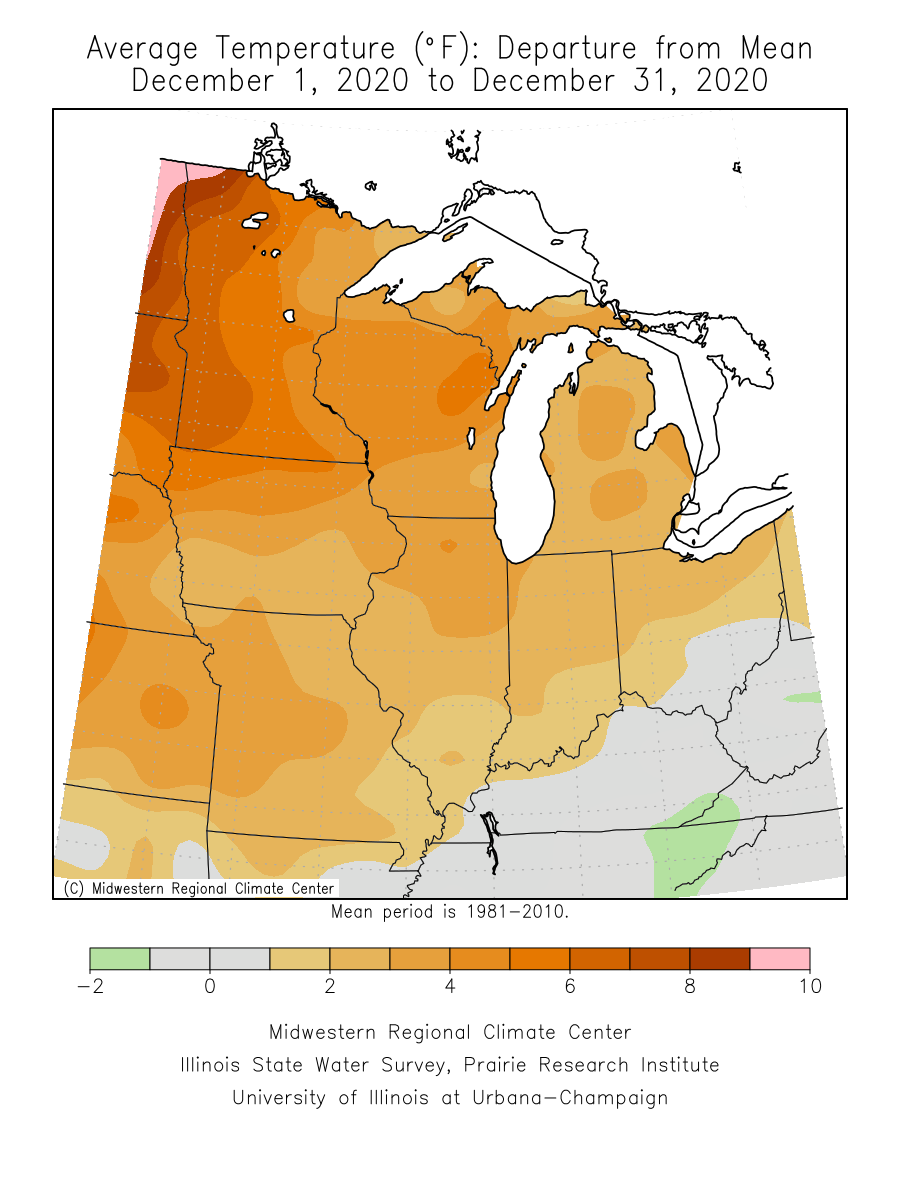
[see: Blizzard, December 23, 2020] - For the third December in a row, statewide average temperatures wound up being above normal. December 2020 was much above normal with a preliminary 5.9 degree temperature departure. On December 9, many locations saw high temperatures in the low 50s. Christmas Eve day saw the coldest weather of the winter so far, with many locations seeing their first subzero temperature of the 20-21 winter. The coldest temperature found in the state was -30 degrees F at Cotton in northeast Minnesota on December 25. The warmest temperatures found was 57 degrees F at Marshall on December 9.
[see: December 2020 Climate Summary Table | 2020 December Departure from Normal Temperature Map]
Where we stand now:
- After a snow-free start to the month, the blizzard on December 23 gave much of Minnesota a snow pack, with more minor snow events following. On January 8, snow cover is fairly thin across southern Minnesota with just an inch or two. There is about three to eight inches on the ground in the Twin Cities metro area. The snowpack deepens to eight inches to around a foot in northeast Minnesota. The deepest snowpack is found in Cook County with depths of 12-18 inches.
[see: Weekly Snow Depth and Ranking Maps | NWS Snow Depth Estimation Map | Midwest Regional Climate Center Snow Depth Map] - The U. S. Drought Monitor map released on January 7, 2021 depicts all but the far southeast with some level of drought designation. Last year at this time the state was free of any drought. About 75% of the state was Abnormally Dry, and 23% of the state in Moderate Drought conditions. A small area in Rock County in southwest Minnesota had Severe Drought conditions. The U.S. Drought Monitor index is a blend of science and subjectivity where drought categories (Moderate, Severe, etc.) are based on several indicators.
[see: Drought Conditions Overview] - The U.S. Geological Survey reports that stream discharge values(where winter measurements are possible) are much above historical medians for the date on most Minnesota rivers. Most rivers and streams are now impacted by ice.
[see: USGS Stream Flow Conditions] - Most lakes in Minnesota froze over between mid–November and the third week of December. The level of Mille Lacs was slightly above the median for early January 2021 and has been above the median since May 2018. The approximate date of lake ice in for Mille Lacs was December 3, one day later than in 2019. The level on Lake Minnetonka on December 3 was 928.51 feet and the Grays Bay Dam closed on October 19. White Bear Lake was at 924.16 feet on January 8, but the reading is affected by ice. The level of Rainy Lake continues to be in the median range and Lake of the Woods continues to be below the median range for early January. Lake Superior was at 602.26 feet on January 8, nine inches higher than the monthly average for early January and six inches lower than the same date in 2020.
[see: Mille Lacs Lake Water Level | Lake Minnetonka Water Level | White Bear Lake Water Level | Lake of the Woods Control Board Basin Data | Corps of Engineers Great Lakes Water Levels] - On November 30, the Agricultural Statistics Service reported that topsoil moisture across Minnesota was 2 percent Very Short, 11 percent Short, 83 percent Adequate, and 4 percent Surplus.
[see: Agricultural Statistics Service Crop Progress and Condition | U. of M. Southwest Research & Outreach Center (Lamberton) | U. of M. Southern Research & Outreach Center (Waseca)] - The potential for wildfires is currently rated by DNR Forestry as Low across Minnesota.
[see: Fire Danger Rating Map] - Soil frost depths under sod are fairly shallow for early January, ranging from a about one foot or less at Minnesota observing locations in the south and central to twenty inches at Grand Forks.
[see: National Weather Service Frost Depth Data | MnDOT Road Frost Depths | University of Minnesota - St. Paul Campus Soil Temperatures Under Sod] - Lake ice in started early due to the cold conditions in mid-November, but mild conditions that followed caused some lakes to thaw and to refreeze again. Some lakes stayed frozen, others had multiple freeze-thaw dates. In general lakes first froze over for good during the last week of November to first half of December, a few days later than historical averages. Mille Lacs froze over around December 3, one day later than its median date. Lake and river ice is never completely safe.
[see: DNR Conservation Officer Reports | 2020 Ice-In Dates] | Median Lake Ice-In Dates]
Future prospects:
- The January precipitation outlook has a tendency for above normal precipitation. January precipitation normals range from near one-half inch of liquid equivalent in western Minnesota to just over one inch liquid in eastern sections of the state. The median snow cover at the end of January ranges from near five inches in southwest Minnesota, to over 15 inches on the ground in northeastern Minnesota (greater than 24 inches along the Lake Superior highlands).
[see: Climate Prediction Center 30-day Outlook | January Precipitation Normal Map] - The January temperature outlook is heavily weighted for above normal temperatures, especially in the northeast. Historically, January is Minnesota's coldest month. Normal January high temperatures range the low-teens in the north, to near 20 in the south. Normal January lows range from near minus 10 degrees in the far north, to the single digits above zero in southern Minnesota.
[see: Climate Prediction Center 30-day Outlook | Temperature Normals] - The 90-day precipitation outlook for January through March indicates an equal chance for below normal, normal and above normal temperatures for all but the far northwest, where there is a slight tilt to below normal temperatures. There is a tendency for above normal precipitation for all but the southwest part of the state, where there’s equal chances for below normal and above normal precipitation.
[see: Climate Prediction Center 90-day Outlook] - The National Weather Service produces long-range probabilistic river stage and discharge outlooks for the Red River, Minnesota River, and Mississippi River basins. These products address both high flow and low flow probabilities.
[see: National Weather Service - North Central River Forecast Center]
From the author:
- Season snowfall for the 2020-21 winter through January 7 across much of the state varies quite a bit from place to place. International Falls is ten inches short of normal, while Duluth is 9.5 inches above normal. The Twin Cities was very close to the normal of 30.5 inches, while Rochester was 9.2 inches. In general, snowfall total so fare are within nine inches of normal across the state.
Upcoming dates of note:
- January 21: National Weather Service releases 30/90 day temperature and precipitation outlooks
![]() Subscribe to email announcements of the monthly posting of this product.
Subscribe to email announcements of the monthly posting of this product.
Pete Boulay, DNR Climatologist