A monthly electronic newsletter summarizing Minnesota's climate conditions and the resulting impact on water resources. Distributed on the first Thursday of the month.
State Climatology Office - DNR Division of Ecological and Water Resources, St. Paul
distributed: June 12, 2026
What happened in May 2026:
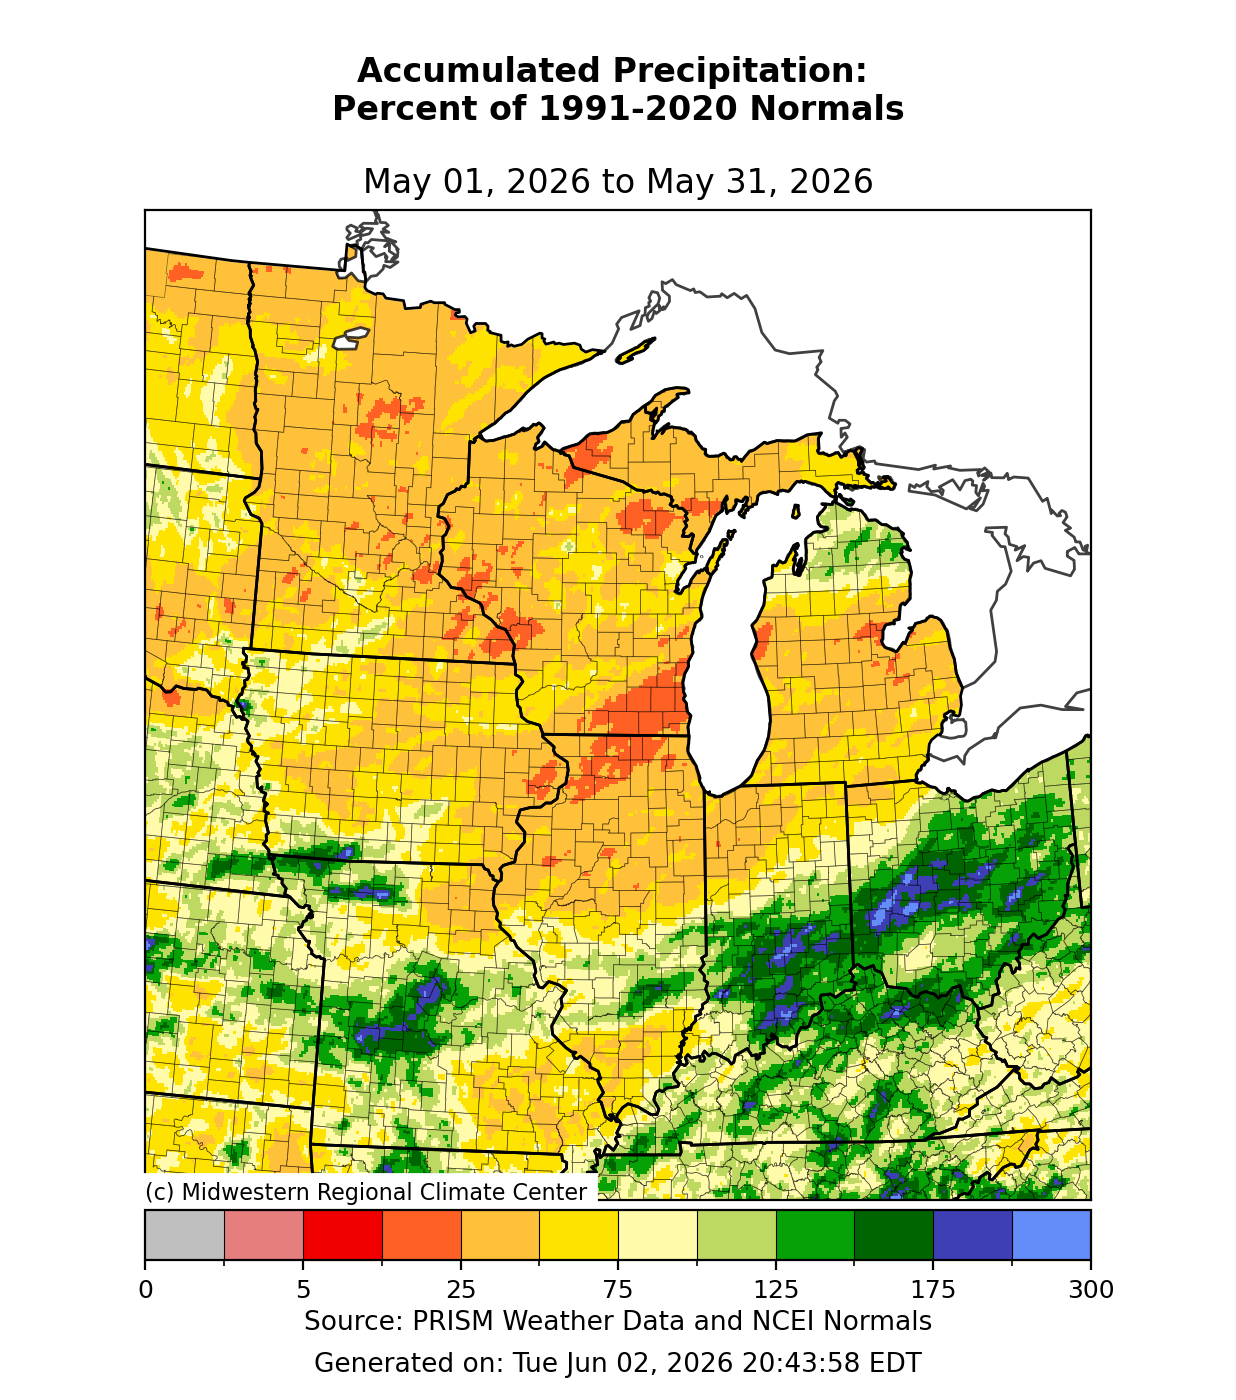
For the second year in a row, May finished with below normal precipitation. The preliminary statewide average precipitation for May 2026 was 1.64 or 2.15 inches below normal. One of the few places that finished with above normal precipitation was Winnebago in Faribault County with 4.74 inches or .23 inches above normal. One of the drier places was Rochester with .86 inches or 3.49 inches below normal. La Crescent Dam in Houston County had 1.13 inches or 3.94 inches below normal.
[see: May 2026 Precipitation Total Map | May 2026 Precipitation Departure Map | May 2026 Climate Summary Table | May 2026 Percent of Normal Precipitation Map]The largest precipitation event of the month was May 17-19, when two different weather systems affected the state in close succession and produced a few tornadoes along with damaging wind gusts in far southern Minnesota. Meanwhile, expanding areas of thunderstorms and rain affected virtually the whole state. The heaviest rains fell over south-central Minnesota and Winnebago had a two-day total of 3.57 inches.
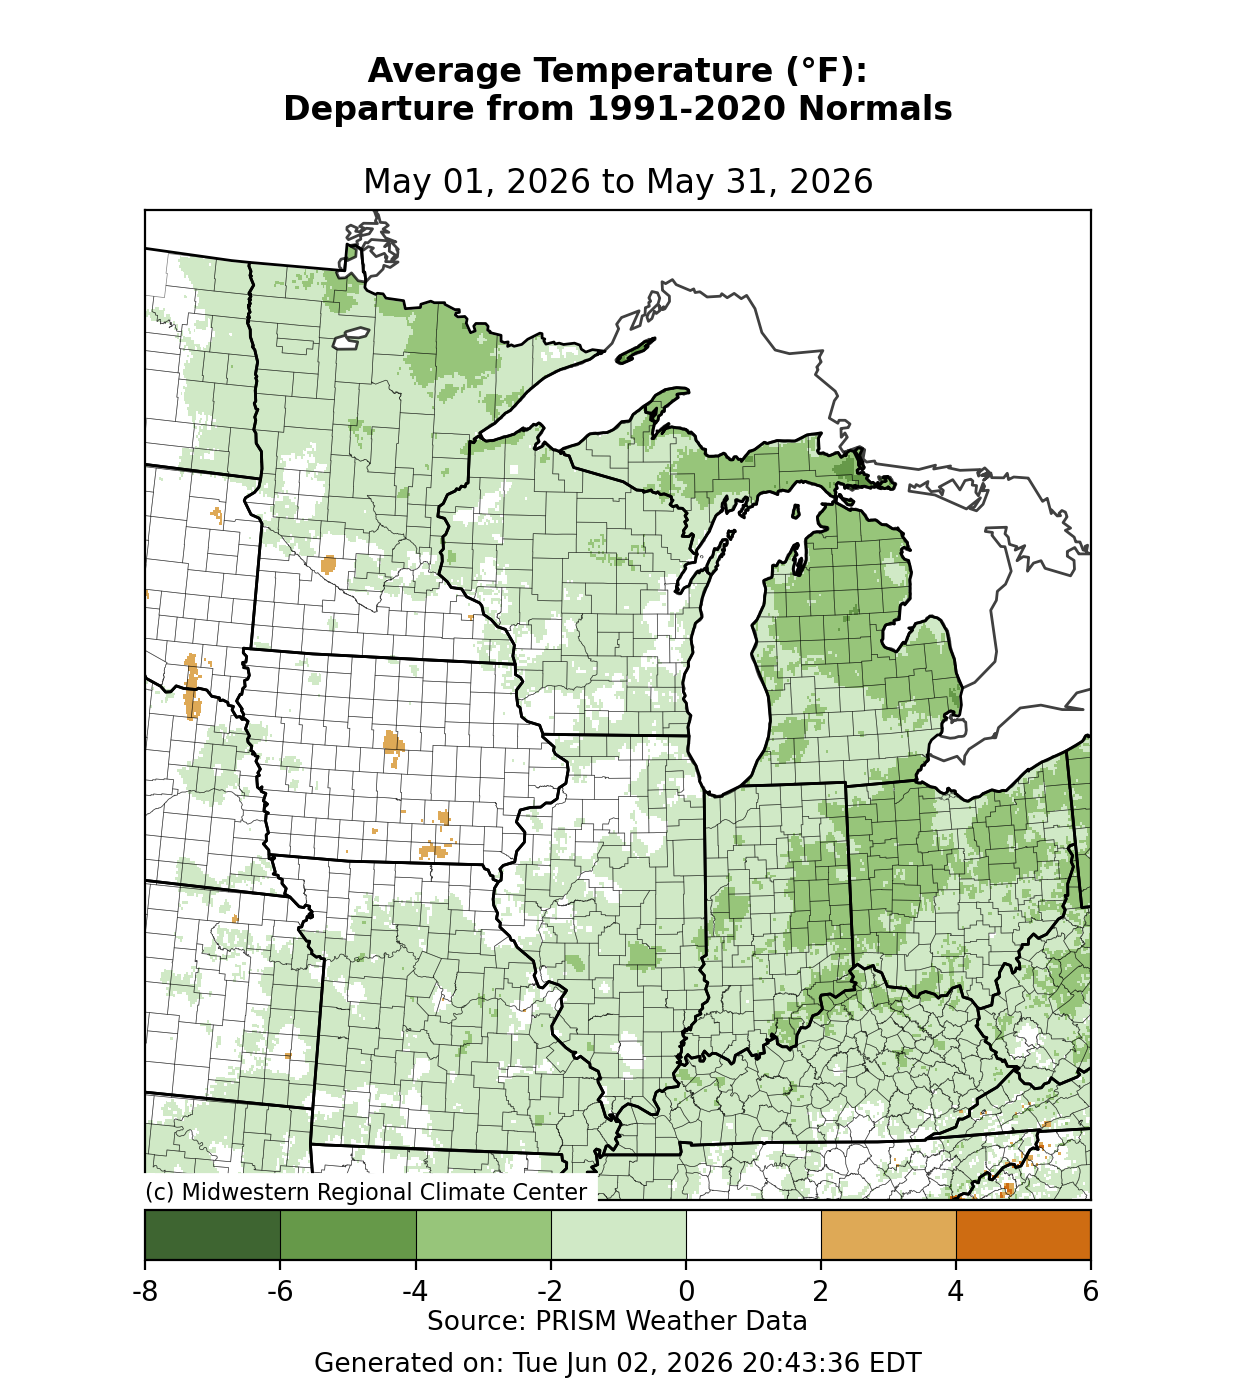
[see: Severe Storms and Much-Needed Rains, May 17-19]The story of May 2026 was of two seasons. The first half of the month was more April-like with some frosts and freezing temperatures during the first week. The last week of the month was a taste of summer with multiple days in the 80s. The hot and cold days generally balanced out and the preliminary average temperature close to normal. The last time there was a May that finished below normal statewide was May 2020. One of the warmest spots in the state for May 2026 was Georgetown, Artichoke Lake, and Madison with maximum temperatures of 95 degrees. The coldest temperature of the month found so far was 15 degrees at Brimson in northeast Minnesota on May 1.
[see: Minnesota Climate Explorer | May 2026 Climate Summary Table | 2026 May Departure from Normal Temperature Map]Warm, dry, and windy conditions led to dangerous fire conditions across much of Minnesota on Friday and Saturday, May 15-16, 2026. Wildfires broke out in parts of northern Minnesota both days [see: Hot and Fiery Weather, May 15-16, 2026]
Where we stand now:
Seasonal precipitation so far (April 1 through June 9) shows that there is near normal moisture in pockets of the state, including west central, far northwest Minnesota and far southeast Minnesota. Wide areas of the north, east and south have a deficit of precipitation. [see: Weekly Precipitation Maps]
Drought conditions persisted over parts of Minnesota this spring, especially in the southwest and the Mississippi Headwaters. The U. S. Drought Monitor map released on June 9, shows that 42% of the state has Abnormally Dry conditions, with 22% of the state having Moderate conditions, 10% of the state having Severe Drought conditions, and a tiny (less than a tenth of a percent Extreme Drought conditions, confined to southwest Minnesota along the South Dakota border. The U.S. Drought Monitor index is a blend of science and subjectivity where drought categories (Moderate, Severe etc.) are based on several indicators.
[see: Drought Conditions Overview]The U.S. Geological Survey reports that stream discharge stream flows as of June 12 are showing a wide range from near normal to much below normal in the north. Stream flows are extremely below historic daily averages on the Mississippi River at Grand Rapids, Aitkin and at Brainerd. However, downstream at St. Cloud the level of the Mississippi River is in the normal range. The Minnesota River is running normal to above normal.
[see: Cooperative Stream Gauging | USGS Stream Flow Conditions]Water levels on most Minnesota lakes vary depending on lake and location in the state. Mille Lacs on June 12 was 10.78 feet, about .15 foot lower than this time last year and about seven tenths below the median. The level on Lake Minnetonka on June 12 was 929.16 ft, about two tenths of a foot lower than last year and 20 cfs was flowing through Grey’s Bay Dam. White Bear Lake was at 923.07 feet, about a two tenths of a foot higher than this time last year. Lake of the Woods is in the middle of the median band and is trending down. Lake Superior was at 601.84 feet, about four tenths of a foot higher than last year at this time and very close to the median.
[see: Mille Lacs Lake Water Level | Lake Minnetonka Water Level | White Bear Lake Water Level | Lake of the Woods Control Board Basin Data | Corps of Engineers Great Lakes Water Levels]The Agricultural Statistics Service on May 27 reported that topsoil moisture across Minnesota is 4 percent Very Short, 24 percent Short, 69 percent Adequate, and 3 percent Surplus. Soil moisture readings at Lamberton on June 1 shows the moisture profile about eight tenths of an inch below the historical average. This is the lowest in five years, but higher than the readings for June 1 from 2012-2014.
[see: Agricultural Statistics Service Crop Progress and Condition | U. of M. Southwest Research & Outreach Center (Lamberton)]The potential for wildfires is currently rated by DNR Forestry as Low over most of the state except the northeast, northwest and a pocket of central Minnesota where there is Moderate fire danger. Historically, 80 percent of all wildfires in Minnesota occur during April and May.
[see: Fire Danger Rating Map]
Future Prospects
The precipitation outlook for June 2026 has equal chances for below, normal and above normal precipitation. June precipitation normals range from just over three inches in northwest Minnesota to about five inches in southeastern counties.
[see: Climate Prediction Center 30-day Outlook | June Precipitation Normal Map]Looking at the Climate Prediction Center, there is a fairly strong tendency for above normal temperatures for June 2026 in Minnesota. Normal June high temperatures are in the low to mid 70s early in the month, rising to around 80 by month's end. Normal June low temperatures are in the low 50s to start the month, and rise to around 60 as the month ends.
[see: Climate Prediction Center 30-day Outlook | June Temperature Normal Map]The 90-day precipitation outlook for June through August indicates a tilt toward below normal precipitation. The June through August temperature projection shows a tendency for equal chances for below, normal and above normal temperatures.
[see: Climate Prediction Center 90-day Outlook]
From the author:
On May 14, 2026, a relatively new warning for Minnesota was issued by the National Weather Service. A “Blowing Dust Warning” was issued for Norman, West Polk, and Clay Counties in west central Minnesota. Dust Storm Warnings started to be issued by the National Weather Service beginning November 1, 2018. This product is issued when widespread, non-thunderstorm-driven blowing dust is reducing visibilities to ¼ mile or less. Winds of 25 mph or greater are usually required and typically a duration of longer than 90 minutes. MNDOT Traffic Cameras captured the event on May 14, 2026, that had the appearance of a dusty fog. These events are not entirely meteorological in nature. Farming techniques also can be a factor.
Upcoming dates of note:
June 18: National Weather Service releases 30/90-day temperature and precipitation outlooks