HydroClim Minnesota for Early March 2020A monthly electronic newsletter summarizing Minnesota's climate conditions and the resulting impact on water resources. Distributed on the first Thursday of the month.State Climatology Office - DNR Division of Ecological and Water Resources, St. Paul
distributed: March 5, 2020
 Subscribe to email announcements of the monthly posting of this product.
distributed: March 5, 2020
What happened in February 2020:
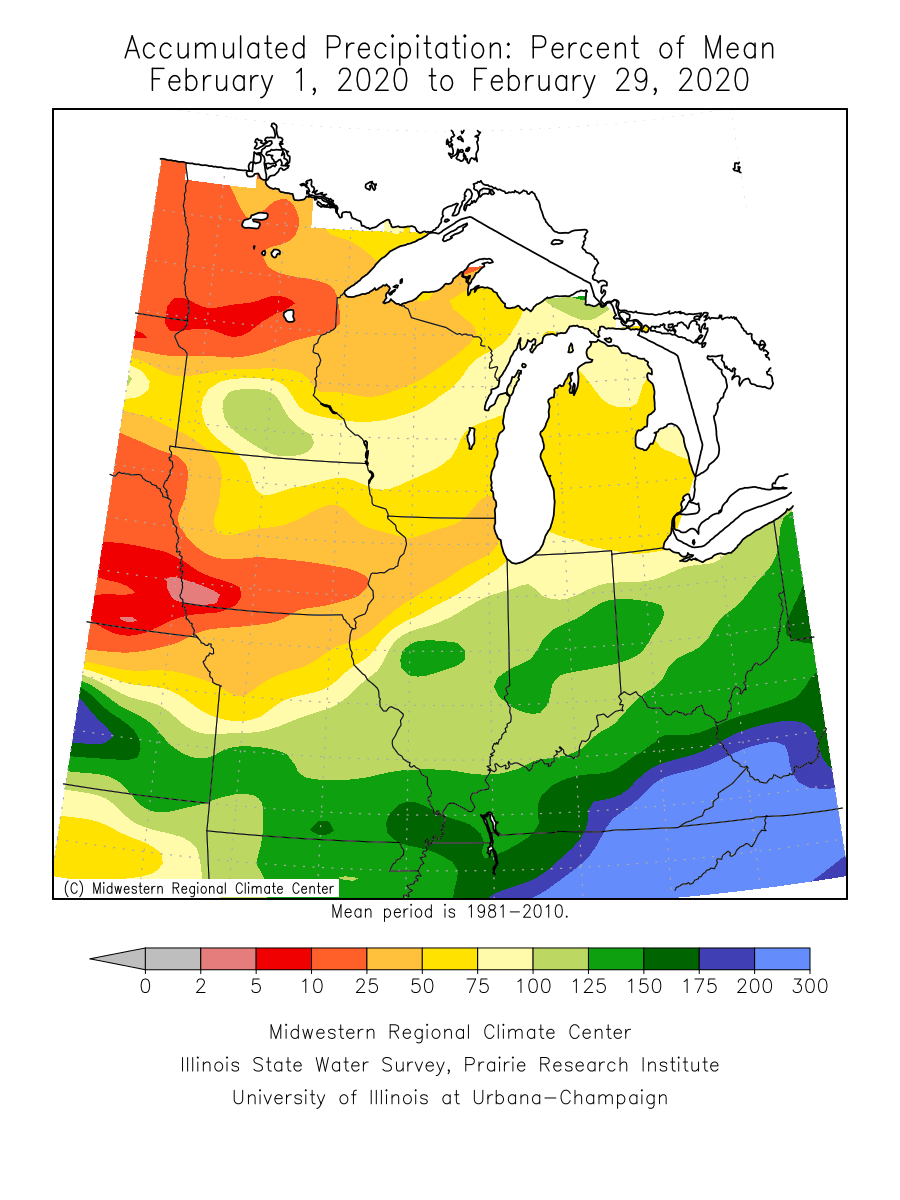
- February is on average the driest month of the year. Normal precipitation is generally less than an inch for most locations. For February 2020, northern and central Minnesota fell short of normal, with quite a few sites finishing less than a half-inch of precipitation. Southern Minnesota saw above normal precipitation, mostly because of a single weather event on February 9 that produced between a half and three-quarters of an inch of precipitation (generally 6-12 inches of snow) over the southern third of the state. One of the higher monthly precipitation totals found was 1.48 inches at New Ulm. The lack of precipitation in general across the central and north was a sigh of relief for those casting a wary eye on the spring melt situation. The preliminary average precipitation total for the state was .43 inches or .26 inches below normal. By contrast, in February 2019, precipitation totals were 300% of normal.
[see: February 2020 Precipitation Total Map | February 2020 Precipitation Departure Map | February 2020 Climate Summary Table | February 2020 Percent of Normal Precipitation Map] - There was one notable snow event for an otherwise quiet month.
- A compact, but intense area of snow brought widespread 6-12" accumulations to southern Minnesota. [see: Snowstorm, February 9, 2020]
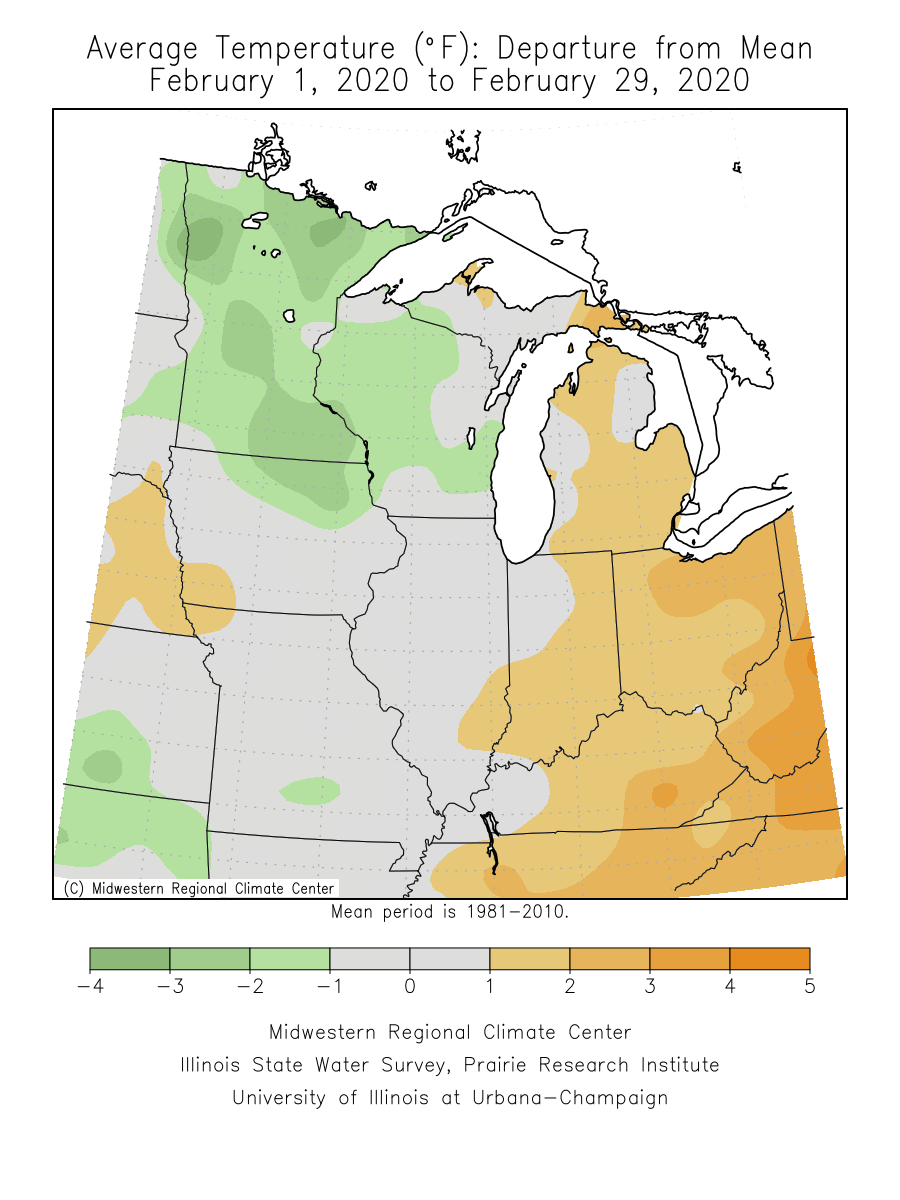
- Statewide temperatures in February had a slight tilt to below normal, with a preliminary average of 15.4 degrees or 1.3 degrees below normal. A few places like the Twin Cities eked out a few tenths of a degree above normal for the month. The coldest temperature found was -40 at Isabella on Valentine’s Day and the warmest temperature was 54 degrees on February 22 at Grand Rapids and also 54 degrees at Cass Lake on February 23.
[see: Minnesota Climate Trends | February 2020 Climate Summary Table | 2020 February Departure from Normal Temperature Map]
Where we stand now:
- February began with very deep snow across northern Minnesota, with many locations ranging from 15 to 24 inches. Snow depth ranking in northern Minnesota was in the 80th percentile or higher. Southern Minnesota had two to eight inches of snow on the ground at the start of February. The February 9th snow storm boosted the snow depth in the south, but balmy conditions for the last week of February and the first week of March eroded the snowpack in the south, with patches of bare ground emerging. The northern half of the state is still holding on to 10 to 20 inches of snow cover, but the snow depth ranking fell to between the 60th and the 80th percentile.
[see: Weekly Snow Depth and Ranking Maps | NWS Snow Depth Estimation Map | Midwest Regional Climate Center Snow Depth Map] - The U. S. Drought Monitor map released on March 5 shows that Minnesota is free of any drought designation. This has been the case since September 2019. The U.S. Drought Monitor index is a blend of science and subjectivity where drought categories (Moderate, Severe, etc.) are based on several indicators.
[see: Drought Conditions Overview] - The U.S. Geological Survey reports that stream discharge values (where winter measurements are possible) are above to much above the historical median for the date for the few Minnesota rivers that have data. Most rivers and streams are now impacted by ice.
[see: USGS Stream Flow Conditions] - In their final report of the 2019 growing season (November 25), the Agricultural Statistics Service reported that topsoil moisture across Minnesota was 0 percent Very Short, 1 percent Short, 64 percent Adequate, and 35 percent Surplus. History has shown that soil moisture conditions observed in the late autumn are indicative of conditions to be expected when the soil thaws. Soil moisture readings at Waseca and at Lamberton finished above the historical median for the final report for 2019. Soil temperatures at the U of M St. Paul Campus Climate Observatory have stayed near 32 degrees at the four inch depth throughout much of the winter.
[see: Agricultural Statistics Service Crop Progress and Condition | U. of M. Southwest Research & Outreach Center (Lamberton) | U. of M. Southern Research & Outreach Center (Waseca)] - The potential for wildfires is currently rated by DNR Forestry as Low across Minnesota.
[see: Fire Danger Rating Map] - Frost depth vary from around a foot in eastern Minnesota, to nearly two feet from west-central Minnesota at Morris to Grand Forks and northwest Minnesota. Lamberton in southwest Minnesota is reporting a frost depth of zero under sod but still 28 inches of frost under bare ground. Thus, frost depth can be highly variable. Dirt roads and exposed ground are thawing in the daytime with some re-freezing at night. Typically the maximum frost depth occurs near the end of February.
[see: National Weather Service Frost Depth Data | MnDOT Road Frost Depths | University of Minnesota - St. Paul Campus Soil Temperatures Under Sod] - Minnesota lakes, rivers, and wetland complexes continue to be ice covered. In general lakes first froze over in early December. Lake and river ice is never completely safe. On March 4, Lake Superior was 6.3% covered by ice, a much lower percentage for this date than last year. In early March 2019, Lake Superior was 93.5% covered by ice. The maximum ice coverage for Lake Superior typically happens in late February.
[see: DNR Conservation Officer Reports | Median Lake Ice-In Dates | Great Lakes Ice Cover ]
Future prospects:
- The March precipitation outlook has equal chances for below normal and above normal precipitation for all but the far north, where there is a tilt toward above normal precipitation. Historically, average March precipitation totals range from near three-quarters of an inch in northwestern Minnesota to around two inches in southern sections of the state. March is a transition month when cold, dry continental air masses are gradually replaced by warm, moist air on a more frequent basis. This is demonstrated by the fact that March's normal precipitation is 50 percent higher than February's normal precipitation, the greatest percentage increase between any two successive months.
[see: Climate Prediction Center 30-day Outlook | March Precipitation Normal Map] - The March temperature outlook indicates a high likelihood for above normal temperatures. Normal March high temperatures climb from near 30 degrees early in the month to the low to mid-40s by month's end. Normal March lows begin the month in the single digits above zero in the far north and mid-teens in the south. By late March, normal lows are in the low 20s in the north, near 30 in the south.
[see: Climate Prediction Center 30-day Outlook | March Temperature Normal Map] - The 90-day precipitation outlook for March through May indicates equal chances for below, normal and above normal precipitation in the northwest with slightly better odds of above normal precipitation for the rest of the state. The March through May temperature projection indicates equal chances for below, normal and above normal temperatures.
[see: Climate Prediction Center 90-day Outlook] - The National Weather Service produces long-range probabilistic river stage and discharge outlooks for the Red River, Minnesota River, and Mississippi River basins. These products address both high flow and low flow probabilities. Here are the current weather conditions impacting prospects for spring snow melt flooding:
- present stream flows are above to much above normal relative to historical flows for the date
- soil profiles are moist due to above normal precipitation in 2019.
- frost depths are shallower than last year and range from about a foot in the east and up to two feet in the west central and northwest. However, frost depth is less of a factor when the soils are saturated.
- snow depths are above the historical median for the date in northern and central Minnesota, with snow water equivalent near to a little above normal in the north.
From the author:
- Winter on the wane? On March 5, the snow depth at the Twin Cities International Airport measured a trace and thus ended the streak of continuous snow cover this winter at 98 days. The first date of continuous snow cover for this season was November 27, 2019. The last time there was a longer stretch was during the memorable winter of 2013-14 with 113 days. The record is 136 days in the winter of 1964-65. There was continuous snow cover until April 10 of that year.
Upcoming dates of note:
- March 19: National Weather Service releases 30/90 day temperature and precipitation outlooks
Pete Boulay, DNR Climatologist