A monthly electronic newsletter summarizing Minnesota's climate conditions and the resulting impact on water resources. Distributed on the first Thursday of the month.
State Climatology Office - DNR Division of Ecological and Water Resources, St. Paul
distributed: May 8, 2023
What happened in April 2023:
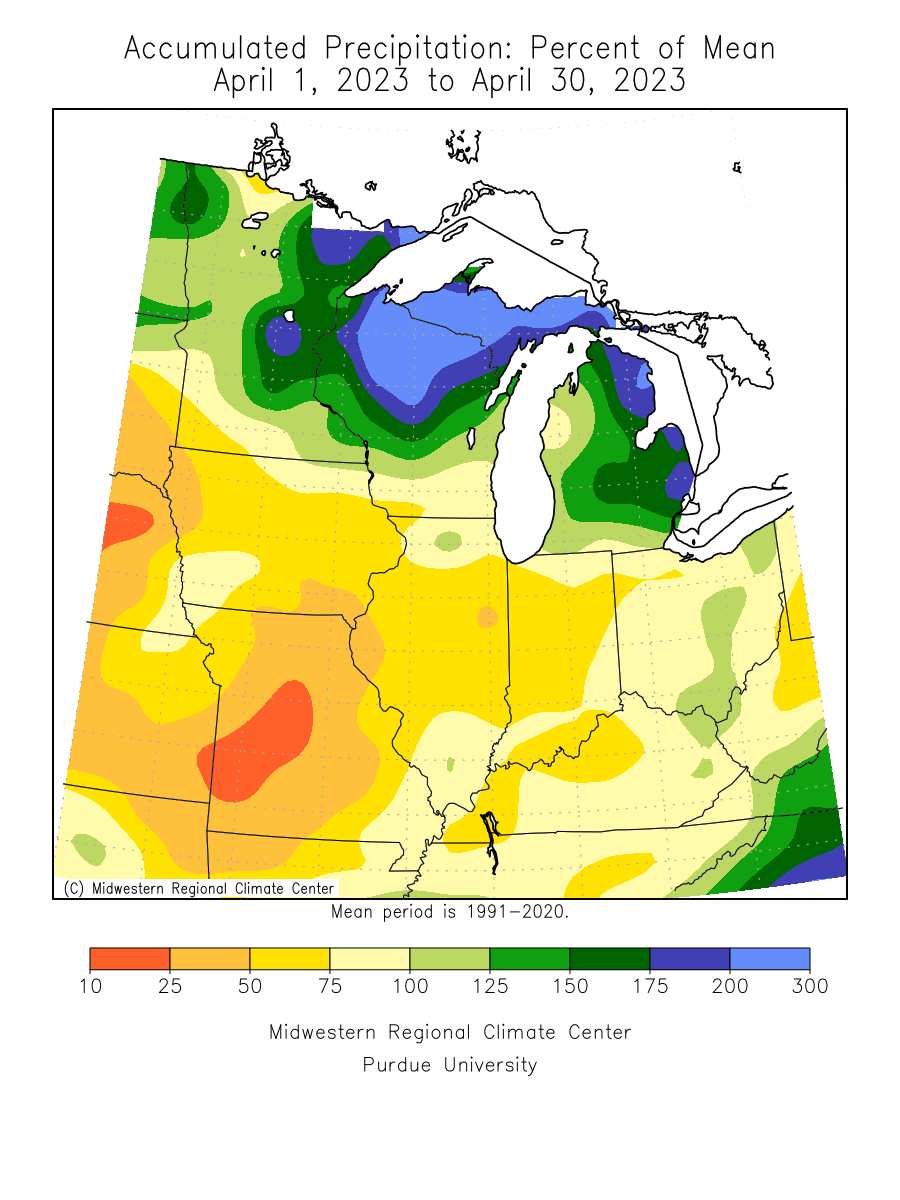
- April 2023 was cool, occasionally rainy, sometimes snowy, with a taste of summer thrown in. The bulk of the precipitation favored the eastern half of Minnesota and was the heaviest over east central parts of the state. The driest locations were in southwest and northwest Minnesota. The highest precipitation total found so far by an observer from the National Weather Service was 7.10 inches, or 4.36 inches above normal at Milaca in Mille Lacs County. One of the drier locations was Warren in Marshall County with .89 inches of precipitation. The preliminary statewide average was 3.06 inches or .32 inches above normal. The Twin Cities finished below normal for precipitation in April with 2.39 inches or .52 inches below normal.
[see: April 2023 Precipitation Total Map | April 2023 Precipitation Departure Map | April 2023 Climate Summary Table | April 2023 Percent of Normal Precipitation Map] - An intense barrage of rain, sleet, thunderstorms, and very heavy snow blasted southern and central Minnesota from Thursday March 30 into Saturday April 1, 2023, resulting in widespread power outages, tree and limb damage, and new daily precipitation records.
[see: March 30 to April Fools' Day, 2023: Thunder, Slush, and Damaging Snow] - A large and intense storm system brought a combination of thunderstorms, rain, sleet, snow, and strong gusty winds to Minnesota from Saturday April 14 into Monday April 17, 2023. Snow was heaviest in extreme southeastern Minnesota, where accumulations of 6-12 inches were common. The Hokah Cooperative observer reported 11.0 inches, with 7 inches at Winona, 6.5 inches at La Crescent, and 6.0 inches at Mabel and Preston.
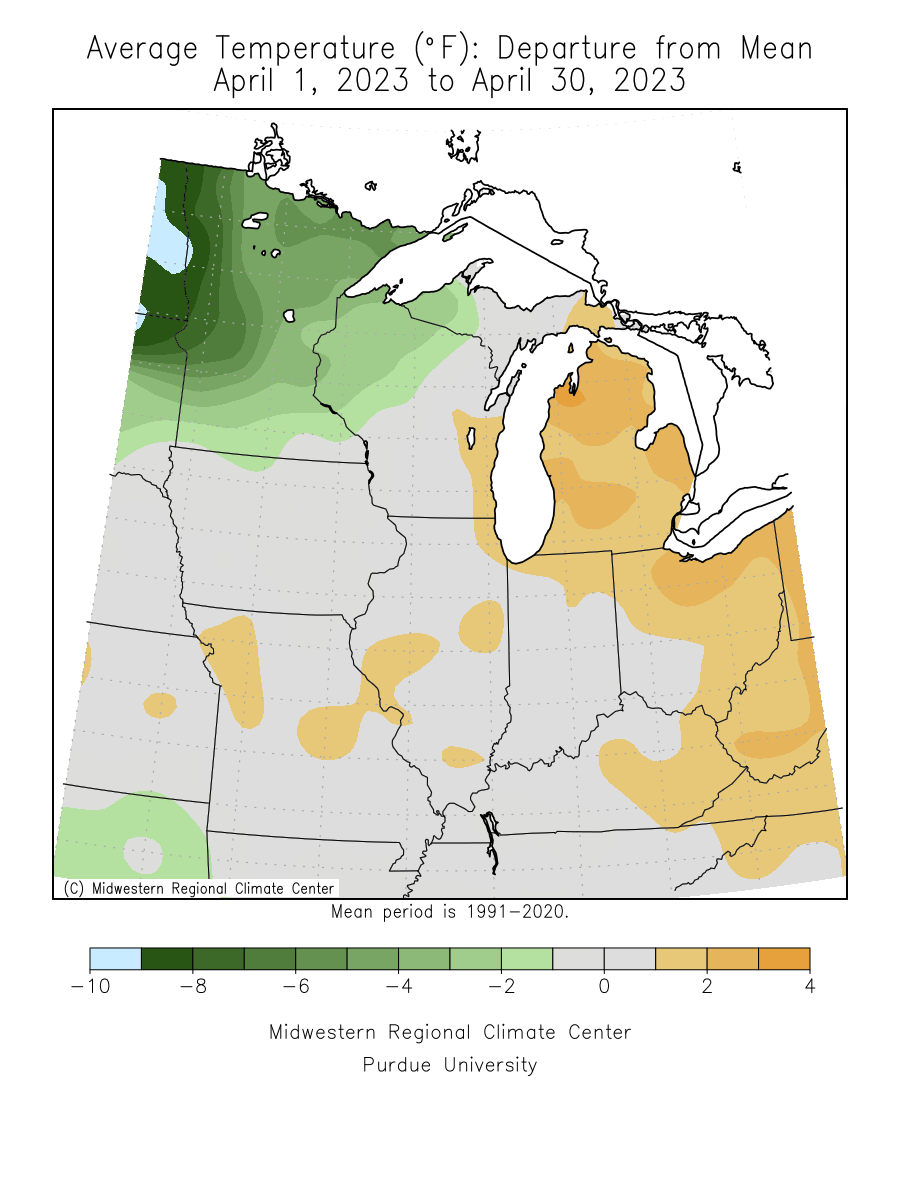
[see: April 12-14: Severe Thunderstorms, Snow, and Wind] - April started cool and ended cool, but had a bit of summer in between. Overall the average statewide temperature for April finished 2.9 degrees below normal. There hasn’t been an overall warm (well above normal monthly temperature) for April since 2017. The mid-month heat wave saved April 2023 from winding up well below normal.
[see: April 2023 Climate Summary Table | 2023 April Departure from Normal Temperature Map - An extremely warm air mass for so early in the year surged across Minnesota April 11-14, eating through the large lingering snowpack and setting daily temperature records. The highest temperature recorded in the state during this period was 95 F at Theilman in southeastern Minnesota. This sensor may have been reading erroneously high, but several temperature stations and airports did record high temperatures of 90 F in the southern third of the state. The highest temperature recorded in the Twin Cities was a daily high temperature record 88 F on Wednesday April 12th; on April 13th, the Twin Cities reach 87 degrees F, setting another record.
[see: The 2023 Mid-April Heat Wave]
Where we stand now:
- Seasonal precipitation totals so far (April 1 through May 2) ranked well above the historical median over the eastern half of the state, with Meeker County ranked in the 98th percentile for the period. Precipitation is below the median over southwest Minnesota.
[see: Seasonal Precipitation, Percent Normal and Ranking Maps] - The final snow depth map of the season was produced on April 27, as the state's snowpack persisted over the northeast. International Falls had its last measurable snow on the ground on April 25. By early May, what snow remained was confined to the higher elevation areas away from Lake Superior. [see: Snow Depth Maps]
- The cool April had enough precipitation to continue to ease the drought situation and on May 2 mainly the western part of the state, covering about 38% of the state was Abnormally Dry, and 1.6% of the state in Moderate Drought conditions, confined to the far south central part of the state. The U.S. Drought Monitor index is a blend of science and subjectivity where drought categories (Moderate, Severe, etc.) are based on several indicators.
[see: Drought Conditions Overview] - The U.S. Geological Survey reports that stream discharge values are generally above normal to much above normal across the central, the northeast and the Red River Valley. Stream flows are near normal in the south, northwest and north central.
[see:USGS Stream Flow Conditions] - Water levels on most Minnesota lakes vary depending on lake and location in the state. There was a decent amount of water flowing out of the Mille Lacs Lake outlet at Vineland. The ice officially was declared out on May 5, but some patches of ice remained in the southwest bay for a few days after that. The median lake ice out date for Mille Lacs is April 25. On May 8, the lake level for Minnetonka was 929.17 feet, about two tenths of a foot higher than a year ago. The Grays Bay Dam has been closed since July 21, 2022. White Bear Lake was at 922.87 feet, about 1.3 feet lower than this time last year. Lake of the Woods and Rainy Lake were both in the median band for early May. Lake Superior was forecast to be at 602.46 feet on May 5, an increase of eight inches from a month ago and eleven inches from last May. Lake Superior is forecast to rise another three inches by June 5, 2023.
[see: Mille Lacs Lake Water Level | Lake Minnetonka Water Level | White Bear Lake Water Level | Lake of the Woods Control Board Basin Data | Corps of Engineers Great Lakes Water Levels] - Warmer temperatures and lighter rain events assisted farmer to get out in the fields. As of May 7, 38 percent of the corn was planted, an improvement from 8 percent a year ago, and right around the five year average. The Agricultural Statistics Service reported on May 9 that topsoil moisture supplies across Minnesota are 3 percent Very Short, 11 percent Short, 72 percent Adequate, and 14 percent Surplus. [see: Agricultural Statistics Service Crop Progress and Condition]
- The statewide fire danger has varied greatly depending on the weather conditions. The recent wet pattern has eased the fire danger somewhat. The potential for wildfires on May 8, rated by DNR Forestry as ranging from Low in southwest, south central and central Minnesota to Moderate over much of Northern Minnesota and parts of the southeast.
[see: Fire Danger Rating Map] - In general, lake ice out is behind median dates. It started out about a week late in the south, and with the four days of summer in mid-April, progress picked up. Then the second half of April arrived and with it cold temperatures and plentiful clouds. By the end of the month, lake ice out was lagging about two weeks behind in central Minnesota. The strong winds and moderating temperatures of the final weekend in April and the first few days of May has picked up the pace of ice out. Warmer conditions for the second week of May is assisting in melting lake ice.
[see: 2023 Lake Ice-Out Dates | DNR Conservation Officer Reports]
Future prospects:
- The May precipitation outlook shows that there will be a tilt toward drier than normal conditions across the state, especially in the south and eastern parts of the state. May precipitation normals range from just over two inches in northwest Minnesota to just less than four inches in southeastern counties. The historical probability of measurable precipitation for any given day in May ranges from 25 percent in the northwest to near 40 percent in the southeast.
[see: Climate Prediction Center 30-day Outlook | May Precipitation Normal Map] - The May temperature outlook has equal chances for above, normal and below normal temperatures. Normal May high temperatures are in the low to mid-60s early in the month, rising to the low to mid-70s at month's end. Normal May low temperatures are in the mid-30s to near 40 to start the month, and climb to the mid-40s to low 50s as the month ends.
[see: Climate Prediction Center 30-day Outlook | May Temperature Normal Map] - The 90-day precipitation and temperature outlook for May through July indicates equal chances of below-normal, near-normal, or above-normal conditions across the state.
[see: Climate Prediction Center 90-day Outlook] - The National Weather Service produces long-range probabilistic river stage and discharge outlooks for the Red River, Minnesota River, and Mississippi River basins. These products address both high flow and low flow probabilities.
[see: National Weather Service - North Central River Forecast Center]
From the author:
- none
Upcoming dates of note:
- May 18: National Weather Service releases 30/90 day temperature and precipitation outlooks
![]() Subscribe to email announcements of the monthly posting of this product.
Subscribe to email announcements of the monthly posting of this product.
Pete Boulay, DNR Climatologist