A monthly electronic newsletter summarizing Minnesota's climate conditions and the resulting impact on water resources. Distributed on the first Thursday of the month.
State Climatology Office - DNR Division of Ecological and Water Resources, St. Paul
distributed: May 9, 2025
What happened in April 2025:
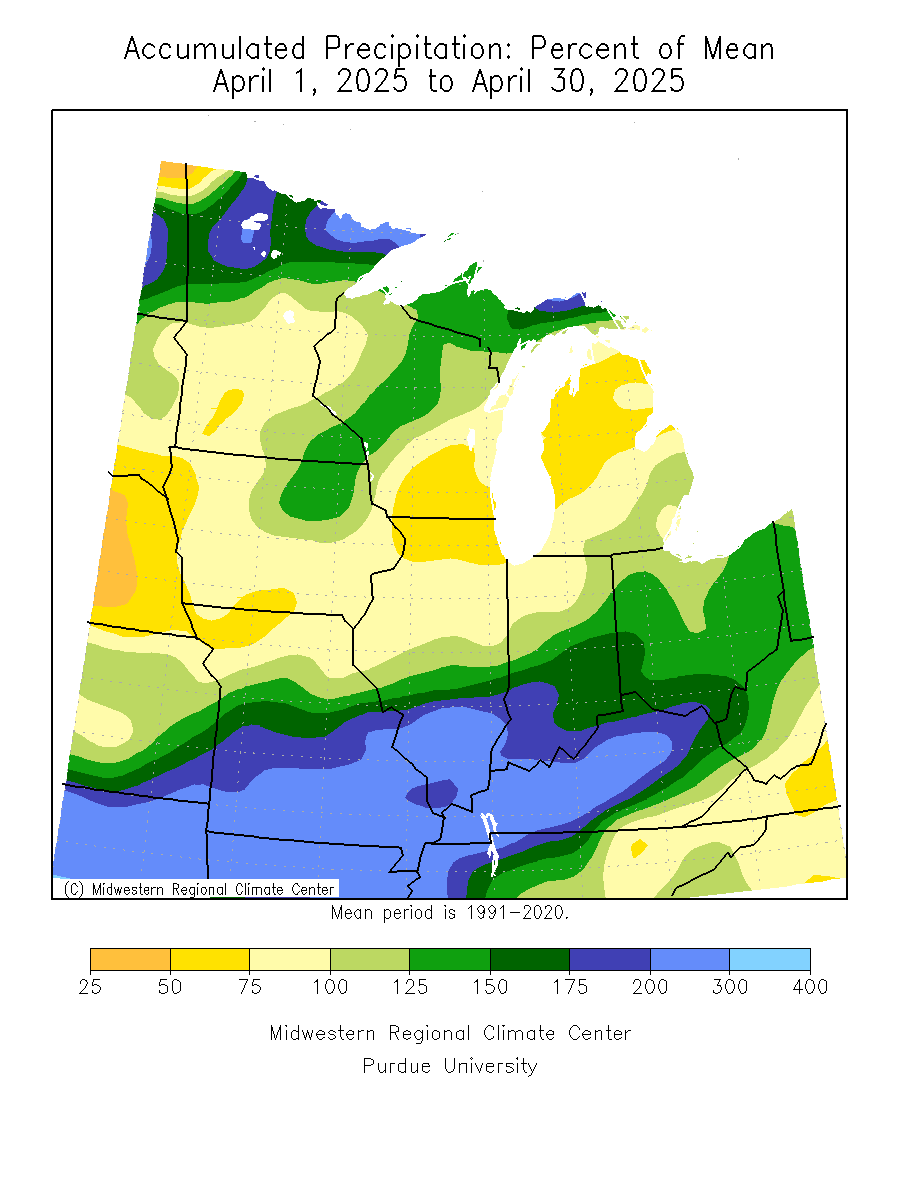
- Overall, April 2025 was generally a little warmer and a tad wetter than normal in Minnesota, but the precipitation was not evenly distributed across the state. The southeast and the northeast had a surplus of moisture, while much of central Minnesota fell short. The highest precipitation total found so far by an observer from the National Weather Service was at Preston in Fillmore County with 7.55 inches or 3.71 inches above normal. One of the drier locations was Lake Bronson Dam in Kittson County with 1.57 inches of precipitation. The preliminary statewide average was 3.07 inches or .37 inches above normal.
[see: April 2025 Precipitation Total Map | April 2025 Precipitation Departure Map | April 2025 Climate Summary Table | April 2025 Percent of Normal Precipitation Map] - There were two main weather events of note in April. First was an April Fool’s Day Storm. A large storm system spanning parts of three days beginning on April Fools' Day (Tuesday April 1, 2025), brought heavy, wet snow to western through northeastern Minnesota, a sticky caking of snow virtually everywhere else, with moderate to heavy rains falling in the southern and eastern parts of the state.
[see: April Fool’s Heavy Snow and Rain, April 1-3, 2025]The first large severe storm outbreak of the season for Minnesota was a highly anticipated event on April 28, with a fairly rare moderate risk of severe storms in Minnesota issued by the Storm Prediction Center. The storms missed the Twin Cities, but two weak tornadoes were reported. The first tornadoes for Minnesota this year. Two were in Rice County, one 8 miles east south east of Faribault and the other three miles east of Morristown. [see: Summary of April 28, 2025 Tornadoes]
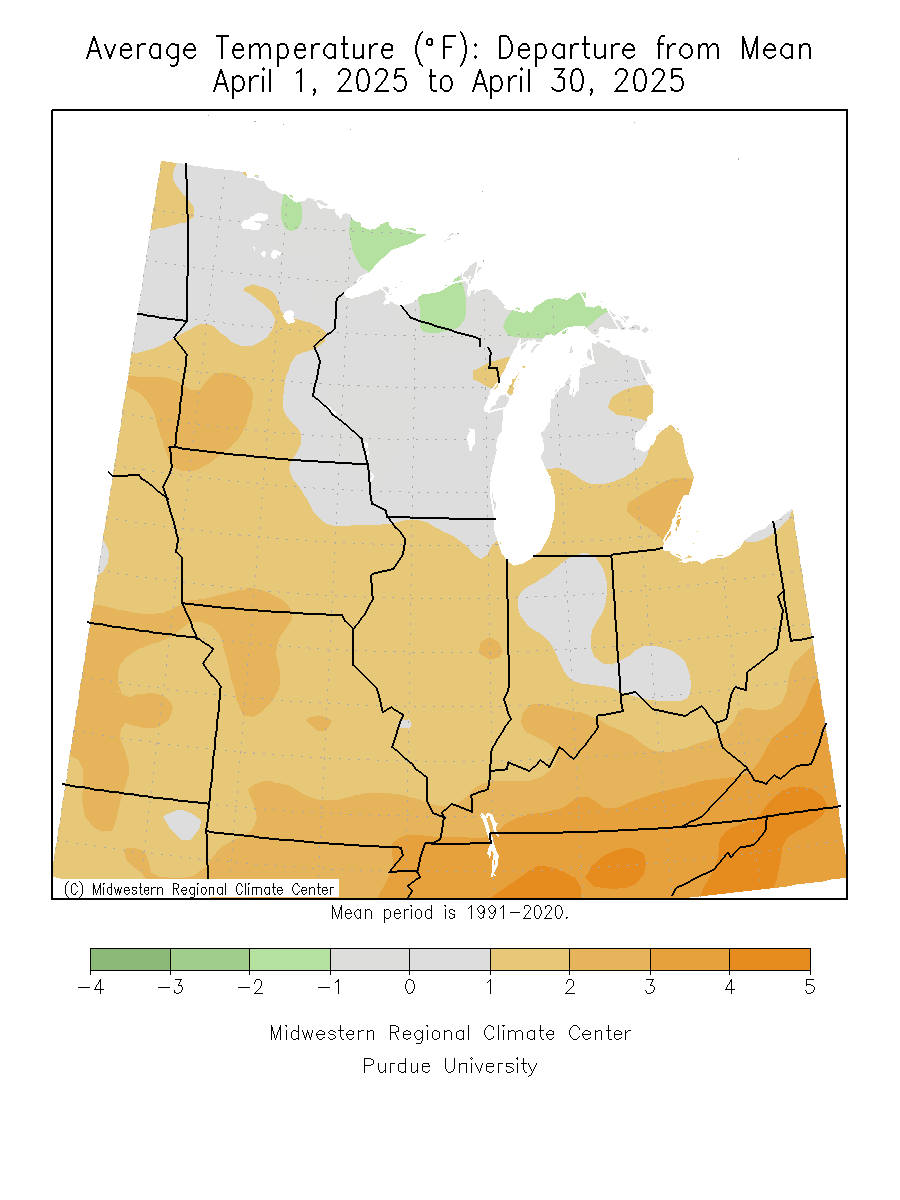
- For the second year in a row, April finished above normal, but not as warm as 2024. Overall, the average statewide temperature for April finished .4 degrees above normal. The warmest temperature found so far was 83 degrees at multiple locations in southwest and south central Minnesota on April 18, and the coldest temperature found so far was -1 degrees at a site northwest of Gunflint Lake on the morning of April 8.
[see: April 2025 Climate Summary Table | 2025 April Departure from Normal Temperature Map
Where we stand now:
- Seasonal precipitation totals so far (April 1 through May 6) ranked well above the historical median over the northern third of the state, except the northwest. Also the ranking was above the median in the southeast as well. Precipitation was close to the median over central and southwest Minnesota.
[see: Seasonal Precipitation, Percent Normal and Ranking Maps] - The final snow depth map of the season was produced on April 17, as the meager state's snowpack faded away in the highlands above Superior. International Falls had its last measurable snow on the ground on April 6. In general, it was the second season in a row of below normal snowfall totals, with slightly better conditions for winter recreation for the winter of 24-25 compared to 23-24. [see: Snow Depth Maps]
- Over the past month, there’s been improvement in the drought situation for the state, except in the far northwest. On the map released on May 1, 25% of the state was free of any drought designation. 52% of the state was Abnormally Dry and 22% of the state was in Moderate Drought conditions. For the first time since October1, 2024 the state was free from Severe Drought conditions. The U.S. Drought Monitor index is a blend of science and subjectivity where drought categories (Moderate, Severe, etc.) are based on several indicators.
[see: Drought Conditions Overview] - The weather pattern was fairly active in April, but there was a scant snowpack to melt. In general, stream flows were near normal, with some exceptions. The Kawishiwi River near Ely was much above normal and on the other side of the spectrum, the Mississippi River near Bemidji was much below normal.
[see:USGS Stream Flow Conditions] - Water levels on most Minnesota lakes vary depending on lake and location in the state. Mille Lacs was at 11.12 feet, about two tenths below the median. The official lake ice out for Mille Lacs was April 18, about a week earlier than the median of April 25, but a month later than in 2024. On May 7, the lake level of Minnetonka was at 929.18 feet, .42 feet lower than this time last year and about the same as this time in 2023. Greys Bay Dam was closed in early May. Lake of the Woods and Rainy Lake are showing recovery were both in the upper end of the median band for early May. Lake Superior was forecast to be at 601.28 feet on May 9, about two inches lower than this time last year. Lake Superior is forecast to rise four inches by June 9, 2025.
[see: Mille Lacs Lake Water Level | Lake Minnetonka Water Level | White Bear Lake Water Level | Lake of the Woods Control Board Basin Data | Corps of Engineers Great Lakes Water Levels] - As of May 4, 44 percent of the corn was planted, about two days ahead of last year and one day ahead of the 5 year average. The Agricultural Statistics Service reported on April 28 that topsoil moisture supplies across Minnesota are 3 percent Very Short, 14 percent Short, 69 percent Adequate, and 5 percent Surplus. [see: Agricultural Statistics Service Crop Progress and Condition]
- With the recent warm and breezy conditions, fire danger has been elevated so far in May .The potential for wildfires on May 9, rated by DNR Forestry as ranging from High over southern, and parts of central and northeast Minnesota and Very High over northwest, west central north central and east central Minnesota. Historically, 80 percent of all wildfires in Minnesota occur during April and May.
[see: Fire Danger Rating Map] - Lake ice out started about two weeks ahead of the median in southern Minnesota, but behind 2024. The first lakes to lose their ice for the 2025 season was Clear and Fish Lakes on March 13, located to the southwest of the town of Ceylon in Martin County. Budd Lake in the same county lost its ice on March 14, two weeks earlier than the median of March 28. White Bear Lake lost its ice on March 28 and Minnetonka on March 29, also two weeks ahead of the median. Somewhat cooler temperatures in April slowed progress a bit and by the time early May arrived, lakes were losing their ice a few days to a week later than the median. Mille Lacs lost its ice on April 18, a week head of the median, while Lake Vermilion lost its ice on May 5, about a week behind the median. By May 7th there was still ice on Rainy Lake and Kabetogama, with ice on some of the larger Boundary Waters Lakes. Warm and windy conditions is speeding up the erosion of the remaining ice.
[see: 2025 Lake Ice-Out Dates | DNR Conservation Officer Reports]
Future prospects:
- The May precipitation outlook shows that there will be a tilt toward drier than normal conditions across the state. May precipitation normals range from just over two inches in northwest Minnesota to just less than four inches in southeastern counties. The historical probability of measurable precipitation for any given day in May ranges from 25 percent in the northwest to near 40 percent in the southeast.
[see: Climate Prediction Center 30-day Outlook | May Precipitation Normal Map] - The May temperature outlook has a fairly strong tendency for above normal temperatures. Normal May high temperatures are in the low to mid-60s early in the month, rising to the low to mid-70s at month's end. Normal May low temperatures are in the mid-30s to near 40 to start the month, and climb to the mid-40s to low 50s as the month ends.
[see: Climate Prediction Center 30-day Outlook | May Temperature Normal Map] - The 90-day temperature outlook for May through July indicates equal chances of below-normal, near-normal, or above-normal conditions across the state with a slight tilt of below normal precipitation in the west. Taking a peek at the summer outlook from June-August there is a tendency for above normal temperatures and below normal precipitation statewide.
[see: Climate Prediction Center 90-day Outlook] - The National Weather Service produces long-range probabilistic river stage and discharge outlooks for the Red River, Minnesota River, and Mississippi River basins. These products address both high flow and low flow probabilities.
[see: National Weather Service - North Central River Forecast Center]
From the author:
Signs of spring are everywhere. In Maplewood, north of St. Paul the first chorus frogs were heard on April 10. The first dandelions were spotted in St. Paul on April 25 with crabapples and lilacs in full bloom by May 7.
[see: Signs of Spring: Phenology ]
Upcoming dates of note:
- May 15: National Weather Service releases 30/90 day temperature and precipitation outlooks
![]() Subscribe to email announcements of the monthly posting of this product.
Subscribe to email announcements of the monthly posting of this product.
Pete BoulayDNR Climatologist