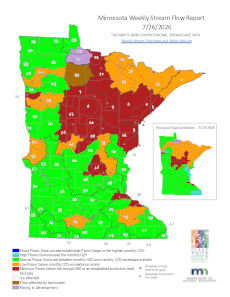
The following maps and tables summarize stream flow conditions throughout Minnesota. Current stream flows are compared with historical flow data and watersheds are ranked in the following categories: flood, high, normal, low, protected. The weekly maps and tables are based on provisional data. Therefore, the values can be affected by storm events, hydropower or dam operations, beaver dams, backwater, ice formation, and other factors that influence stream flows. The maps and tables are offered in PDF format.