

A monthly electronic newsletter summarizing Minnesota's climate conditions and the resulting impact on water resources.
State Climatology Office - DNR Division of Ecological and Water Resources, St. Paul
distributed: August 12, 2026
What happened in July 2026:
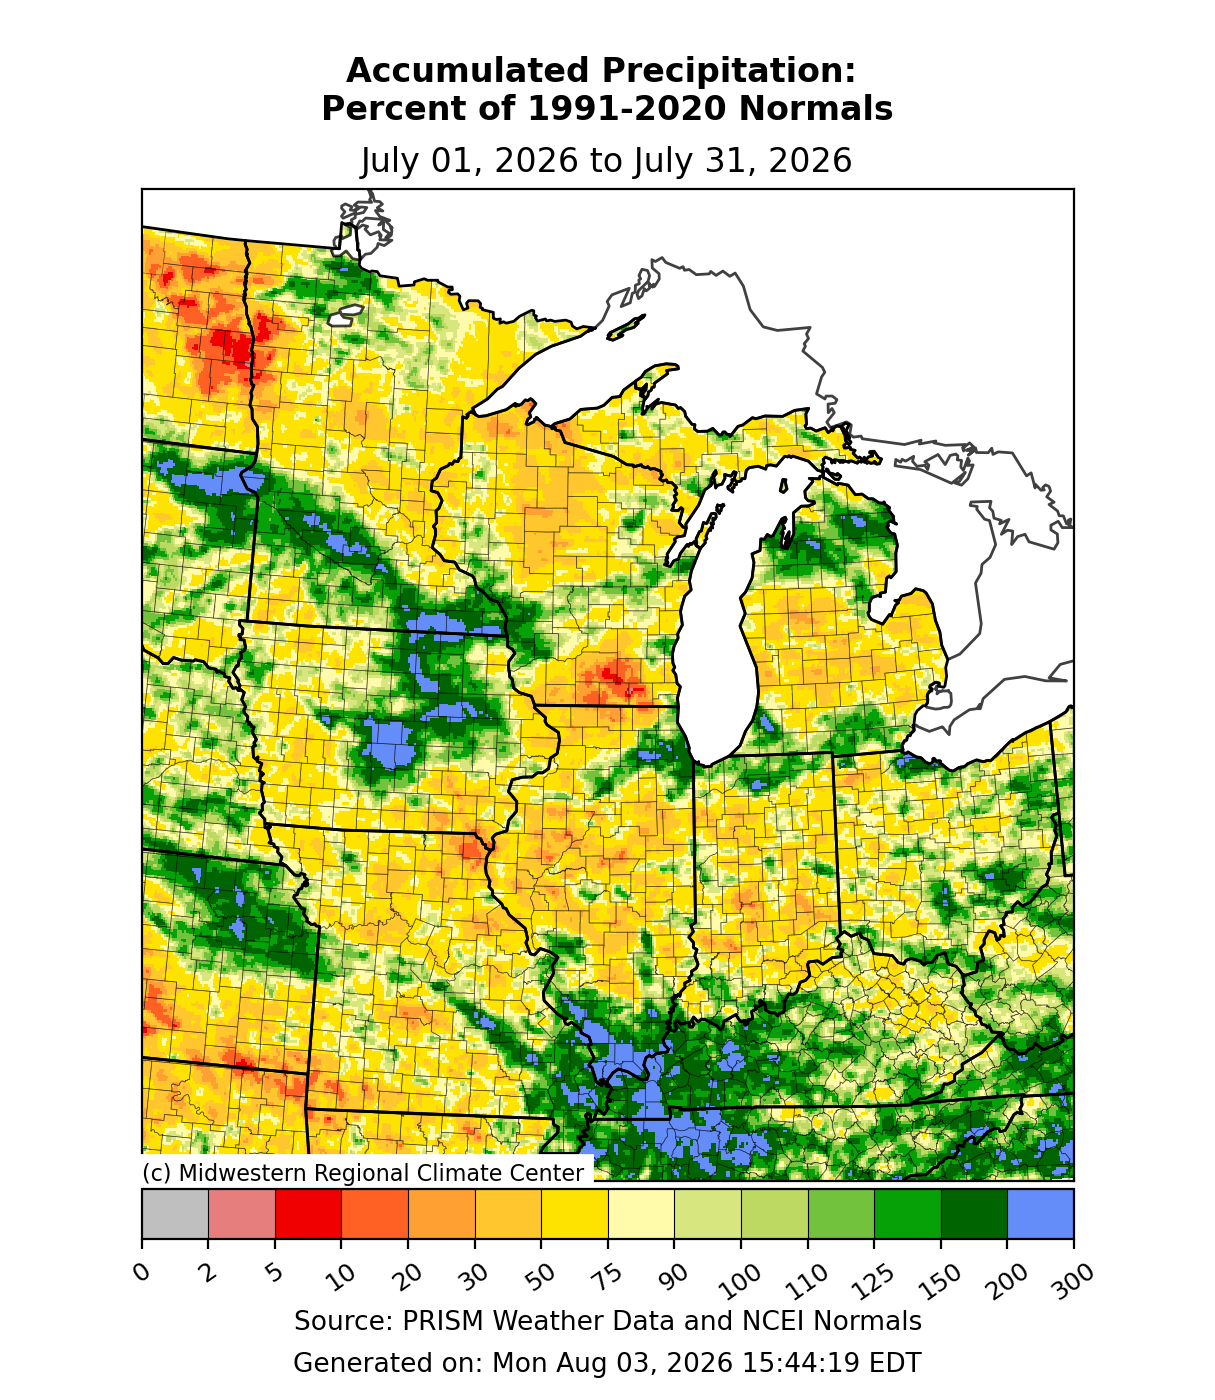
Minnesota saw a wide range of precipitation in July 2026, ranging from excessive to meager. The preliminary statewide average precipitation was 3.82 inches or .13 inches below normal. Pockets of the state were quite wet, especially in a strip from Renville County, southeastward to Mower and Fillmore County. The wettest location found so far was Grand Meadow in Martin County with 13.20 inches or 8.54 inches above normal. One of the drier spots found so far was at Wolf Ridge in Lake County with 1.33 inches of precipitation or 1.92 inches below normal.
[see: July 2026 Precipitation Total Map | July 2026 Precipitation Departure Map | July 2026 Climate Summary Table | July 2026 Percent of Normal Precipitation Map]July 2026 had large rain events at the beginning and the end. An area of stalled, slow-moving, and regenerating heavy thunderstorms from late Wednesday July 1 into Thursday July 2, 2026, produced dangerous flash flooding across southeastern Minnesota. Observers in Preston, Lanesboro, Spring Valley, and Harmony all received at least six inches of rain over these two dates; during the same period, an observer in Mabel recorded 8.28 inches, with 8.19 inches in Caledonia and 8.05 inches in Grand Meadow. [see: Mega-Rain and Flash Flood, July 1-2, 2026 ]
The second event featured slow-moving and regenerating thunderstorms with heavy rain affected much of Minnesota from late on July 30th into the afternoon of July 31st. The highest total reported anywhere in the state was 6.80 inches reported by a CoCoRaHS observer near Raymond in Chippewa County. Other totals exceeding six inches were reported from the same network near Bird Island, Brownton, and Le Sueur, with amounts of 3-6 inches from Ortonville, to Willmar, to Glencoe, to Owatonna. The National Weather Service observer at the Brownton Wastewater Treatment Plant in McLeod County reported 5.56 inches.
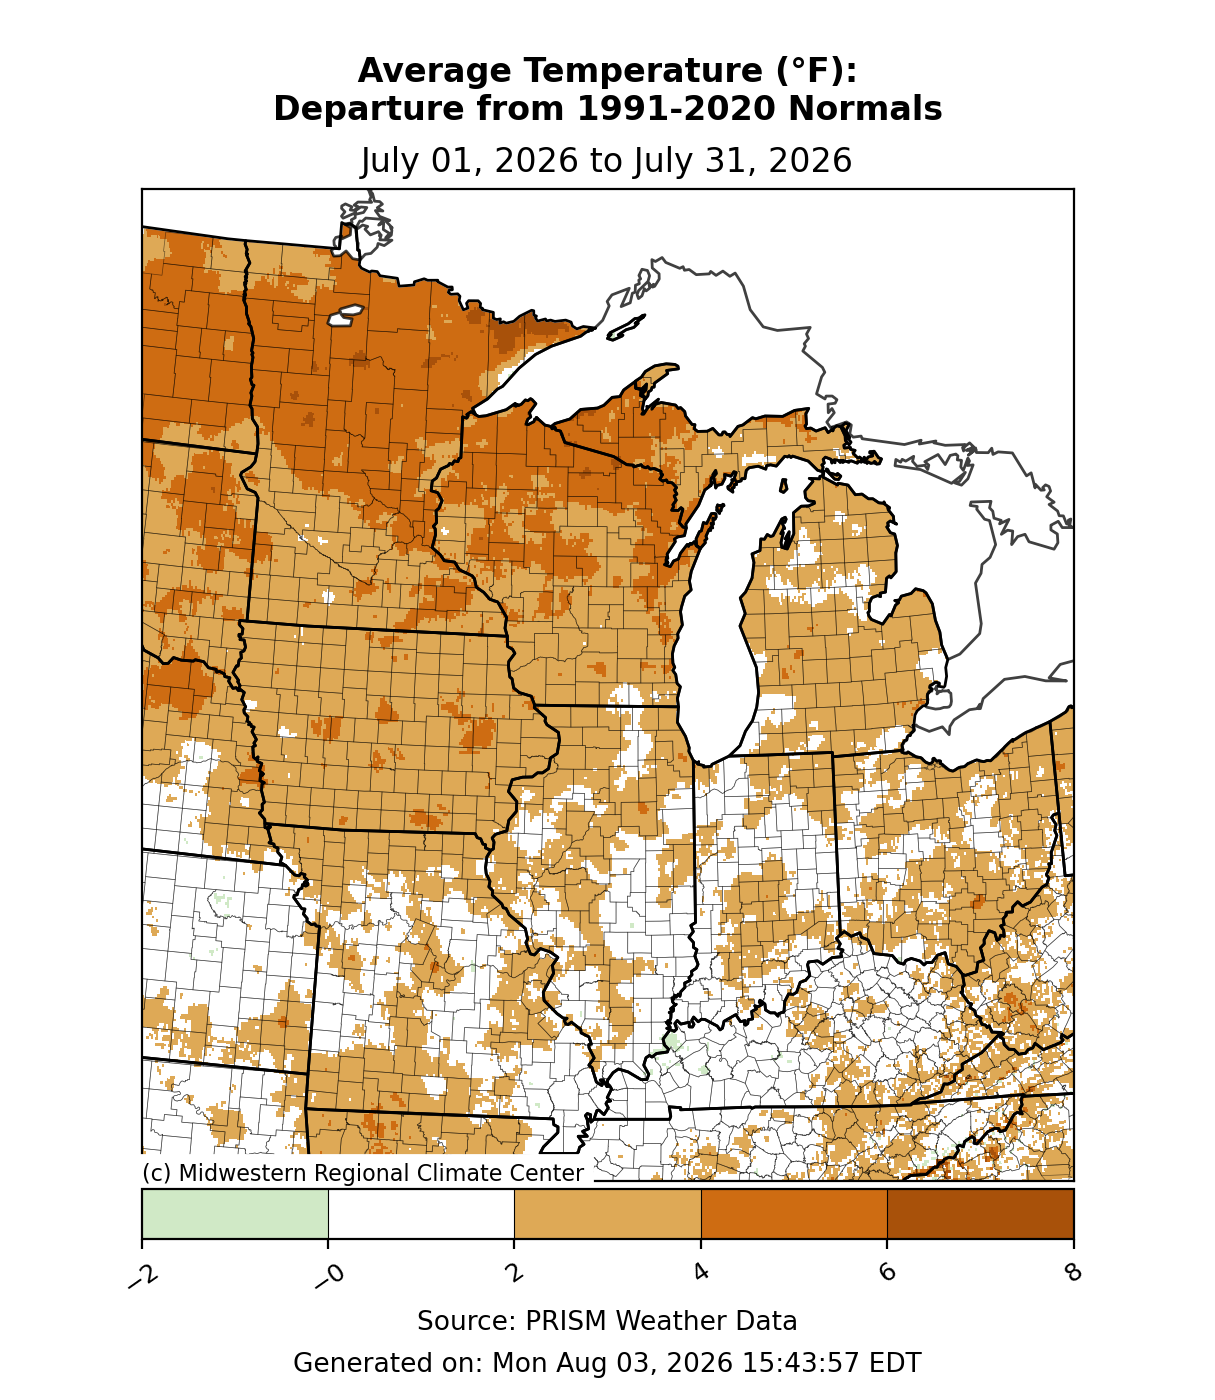
[see: Intense Rains Near Minnesota River, July 30-31, 2026]The statewide preliminary average temperature for July 2026 was 73.8 degrees, or 4.3 degrees above normal, making July 2026 around the 5th warmest July for Minnesota with records going back to 1895. The warmest temperature reported in Minnesota for July 2026 was 101 degrees at Georgetown in Clay County on July 26th. The coldest temperature found so far was 35 degrees on July 6th at Wolf Ridge in Lake County.
[see: July 2026 Climate Summary Table | 2026 July Departure from Normal Temperature Map]While July 2026 was noteworthy for two heavy rain events, it was also notable for some periods of high heat and humidity. A long-duration heat wave affected Minnesota from Saturday July 11 through Monday July 20, with widespread temperatures in the 90s F across virtually all of the state for at least part of the time. The highest temperature recorded officially during this heat wave (July 11-20) was 100 F at Kettle Falls, which is on the Canadian border near Rainy Lake. The Twin Cities had 10 days in a row with high temperature of at least 90 degrees F, which was the third longest such streak on record
[see: Mid-July Heat Wave, 2026]It wasn’t just the heat; it was the humidity as well. In the early morning of July 27, 2026, the MSP airport recorded six consecutive hours of 80-degree F dew point temperatures, with a maximum reading of 81 F at 2 AM, making this one of the most intensely humid dates on record for the Twin Cities.
[see: 80-Degree Dew Point Temperatures in the Twin Cities]


Where we stand now:
Seasonal precipitation so far (April 1 through August 11) shows that large sections of the state are falling short of normal. East Central, west central and parts of northern Minnesota are 60 to 80% of normal. The exception is a swath from eastern Yellow Medicine County southeastward though Blue Earth County and then to Mower and Fillmore County. Some of these areas have 125-150% of normal precipitation. are a few exceptions, on the high side in west central Minnesota some areas are up to 150% of normal and on the low side in far northwestern Minnesota some areas are in the 40-60% of normal range.
[see: Seasonal Precipitation Maps]The U. S. Drought Monitor map released on July 30 depicts 19% of the state in the Abnormally Dry category, 36% in the Moderate Drought category and 34% in the Severe Drought category. One year ago, the 93% of the state was free of any drought categories. The U.S. Drought Monitor index is a blend of science and subjectivity where drought categories (Moderate, Severe, etc.) are based on several indicators.
[see: Drought Conditions Overview]The U.S. Geological Survey reports that stream discharge levels range from normal to above normal in the south, to generally below normal in the central and north. On August 12, There are three locations that have extremely below water levels for this time of year. These are: the Mississippi at St. Cloud, The Snake River near Pine City and the Knife River near Two Harbors. The Crow River is running above normal and is giving a boost to the Mississippi above Anoka.
[see: Cooperative Stream Gauging | USGS Stream Flow Conditions]Water levels on Minnesota lakes vary depending on lake and location in the state. On August 12, Mille Lacs was at 10.49 feet, about a half a foot lower than this time last year. Minnetonka was at 928.75 feet on August 12 with 12cfs flowing though Greys Bay Dam. The dam has been letting water out all summer. White Bear Lake was at 922.56 feet on August 12, about six tenths of a foot lower than this time last year. Rainy Lake is in the normal band for August lake level. Lake of the Woods is below the median band for August. Lake Superior was forecasted to be at 602.07 on August 11, about a tenth of a foot higher than this time last year.
[see: Mille Lacs Lake Water Level | Lake Minnetonka Water Level | White Bear Lake Water Level | Lake of the Woods Control Board Basin Data | Corps of Engineers Great Lakes Water Levels]The Agricultural Statistics Service on August 10 reports that topsoil moisture across Minnesota is 9 percent Very Short, 31 percent Short, 54 percent Adequate, and 6 percent Surplus. Available soil water at Lamberton on June 15 was 6.01 inches, about three quarters of an inch above the historical average of 5.258 inches.
[see: Agricultural Statistics Service Crop Progress and Condition | U. of M. Southwest Research & Outreach Center (Lamberton)]The potential for wildfires rated by DNR Forestry on August 12, as Low over the south and north central, and Moderate over central, northeast and northwest Minnesota. Elevated burning restrictions continue for a large part of northeast Minnesota. Historically, 80 percent of all wildfires in Minnesota occur during April and May.
[see: Fire Danger Rating Map]
Future prospects:
The August precipitation outlook has equal chances for above, normal and below normal precipitation over not only Minnesota, but surrounding states as well. August precipitation normals range from about two-and-a-half inches in northwest Minnesota to about five inches in southeastern counties. The August temperature outlook has equal chances for above, normal and below normal temperatures for all but the far south, where there is a slight tilt for above normal temperatures in the north. Normal August high temperatures are around 80 degrees to start the month, dropping to the mid-70s by month's end. Normal lows are around 60 degrees early in the month, falling to the mid-50s by late August.
[see: Climate Prediction Center 30-day Outlook | August Temperature Normal Map]The 90-day precipitation outlook for August through October has a tendency for below normal precipitation over much of the central and north, especially the northeast. The rest of the state has equal chances of below, normal and above normal precipitation. What does the winter of 2026-27 hold? There is a fairly strong tilt for above normal temperatures across Minnesota, especially in the north. The precipitation outlook has equal chances for above, normal and below normal precipitation.
[see: Climate Prediction Center 90-day Outlook | Meteorological Winter 2026-27]The National Weather Service produces long-range probabilistic river stage and discharge outlooks for the Red River, Minnesota River, and Mississippi River basins. These products address both high flow and low flow probabilities.
[see: National Weather Service - North Central River Forecast Center]
From the author:
Just like in 2025, smoke has been an issue during the summer of 2026. Minnesota made it through the first half of summer 2026 with few wildfire smoke issues, but that all changed after fires erupted in and near the Boundary Waters in early and mid-July, producing the most intense smoke pollution on record in the state. On Wednesday, July 15 the densest plume of smoke moved over the state, prompting the MPCA to heighten many alerts to the "Maroon" or "Hazardous" level, which is the most dangerous category on the Air Quality Index (AQI). In many areas including the Twin Cities, this level of alert had not been issued previously. At a West Duluth sensor, the concentrations of fine particulates apparently broke the state's all-time hourly record, measuring 617.8 ug/m3 ("micrograms per cubic meter of air") at 10 AM. [see: Dangerous Smoke Outbreak, July 14-17, 2026]
Upcoming dates of note:
August 20: National Weather Service releases 30/90 day temperature and precipitation outlooks
 Subscribe to email announcements of the monthly posting of this product.