A monthly electronic newsletter summarizing Minnesota's climate conditions and the resulting impact on water resources.
State Climatology Office - DNR Division of Ecological and Water Resources, St. Paul
distributed: February 13, 2026
What happened in January 2026:
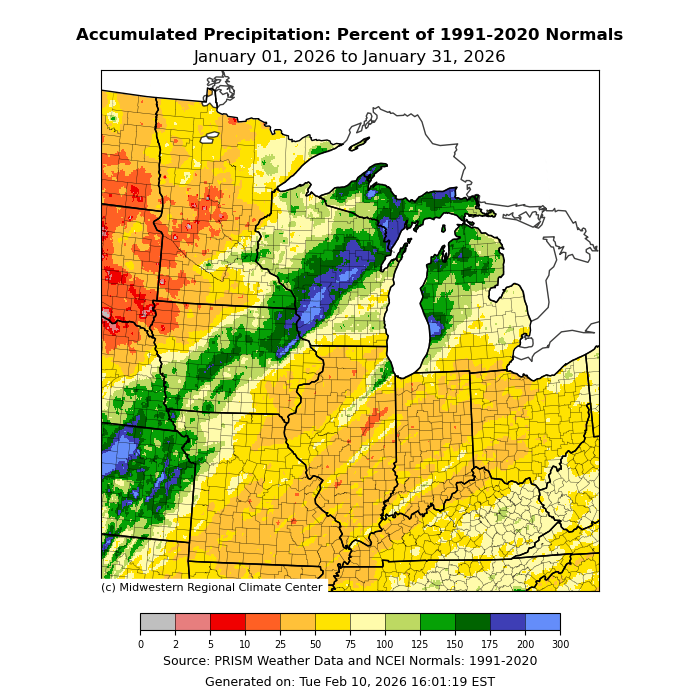
Precipitation in January 2026 was dominated by Clipper-type systems, with one unusual rain event in east central Minnesota during a ‘January Thaw.” Clippers tend to be moisture-starved and statewide precipitation fell short of normal. The preliminary statewide average was .60 inches or .20 inches short of normal. This was the third January in a row with below normal precipitation. January 2025 was quite a bit drier and was tied for the 9th driest on record. The site with the most precipitation so far for January 2026 was 1.54 inches, or .42 inches above normal at Caledonia in southeast Minnesota. One of the drier locations was at Milan in Redwood County with .17 inches or .60 inches below normal.
[see: January 2026 Precipitation Map | January 2026 Precipitation Departure Map | January 2026 Climate Summary Table | January 2026 Percent of Normal Precipitation Map]There was one interesting precipitation event of note for January 2026. A narrow but surprisingly intense area of freezing rain and rain made an overnight mess of things across parts of southern Minnesota from late on Monday January 5th into early on Tuesday January 6th, 2026. Measurable rain fell over about a third of the state, mostly in southern and eastern Minnesota, with most areas receiving under a tenth of an inch of precipitation. Some of the heaviest rain fell in and near the Twin Cities, where totals of a half-inch or more were common. At the Twin Cities International Airport, the daily total of 0.69 inches was a record for January 6th, breaking the old record of 0.40 inches in 1967.
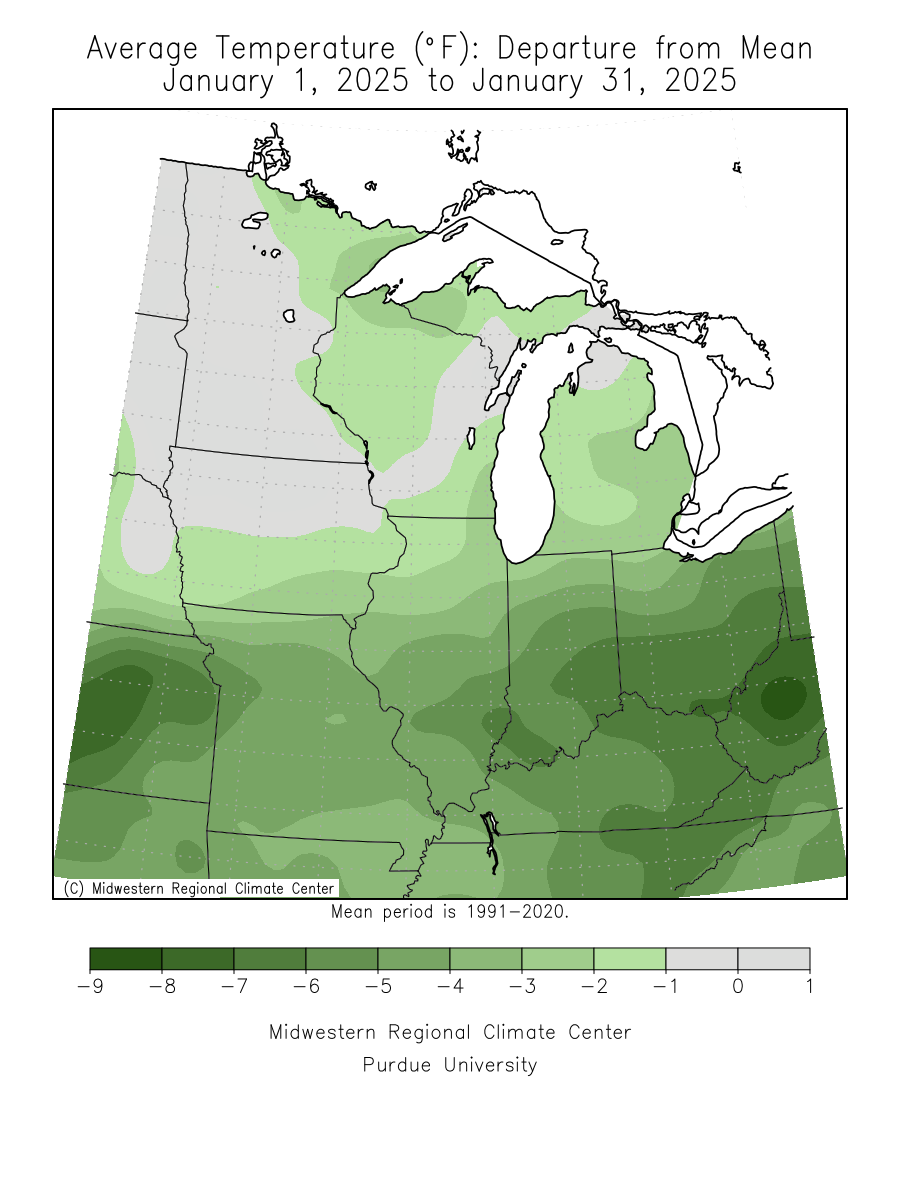
[see: Icy Rain, January 5-6, 2026]January 2026 was the second month in a row that was below normal for average monthly temperature. January 2026 had a preliminary statewide average temperature of 9.7 degrees or 1.6 degrees below normal. Marshall and Canby both had 53 degrees with a snow-free landscape giving an assist on January 13. For the coldest locations, both Celena and Embarrass had minimum temperatures of -41 degrees F on January 24.
[see: January 2026 Climate Summary Table | January 2026 Departure from Normal Temperature Map
Where we stand now:
On February 12, with dry and warm conditions, the snowpack is eroding over the central and south. Deeper snow is hanging on in the north, especially the northeast.
[see: Weekly Snow Depth and Ranking Maps | NWS Snow Depth Estimation Map | Midwest Regional Climate Center Snow Depth Map]The U. S. Drought Monitor map released on February 12, 2026 depicts 36% of the state free of any level of level of drought designation. About 33% of the state was Abnormally Dry, and 26% of the state in Moderate Drought conditions. 4% of the state are in Severe Drought conditions. The U.S. Drought Monitor index is a blend of science and subjectivity where drought categories (Moderate, Severe, etc.) are based on several indicators.
[see: Drought Conditions Overview]The U.S. Geological Survey reports that stream discharge values in Minnesota (where winter measurements are possible) are below normal on the Mississippi from Aitkin to St. Cloud, but normal in the Twin Cities. Ice jamming is not currently expected to pose a significant issue as we warm up, as an excessive amount of flow would be required to cause any problems. The Minnesota River at Lac qui Parle is much above normal. Most rivers and streams are impacted by ice.
[see: USGS Stream Flow Conditions]In their final report for the season, On November 29, 2025 the Agricultural Statistics Service reported that topsoil moisture across Minnesota was 3 percent Very Short, 19 percent Short, 74 percent Adequate, and 5 percent Surplus. Harvest was finishing up by the end of November. Soil moisture levels at Lamberton on November 15, 2025 showed soil moisture a little above historical averages.
[see: Agricultural Statistics Service Crop Progress and Condition | U. of M. Southwest Research & Outreach Center (Lamberton) | U. of M. Southern Research & Outreach Center (Waseca)]The potential for wildfires is currently rated by DNR Forestry as Low across Minnesota.
[see: Fire Danger Rating Map]With the relatively cold second half of January frost is fairly deep this season, Frost depths for early February range from one to two feet deep in the south, and six inches to 32 inches deep in the central and north. With the warm conditions in the south the top few inches are beginning to thaw.
[see: National Weather Service Frost Depth Data | MnDOT Road Frost Depths | University of Minnesota - St. Paul Campus Soil Temperatures Under Sod]Compared to the last two winters (2023-2024 and 2024-2025) There were decent lake ice conditions in January 2026. The difference was that in both January 2024 and 2025, there was a warm spell with temperatures in the 40s and 50s for the last week of the month. In 2026, despite two January thaws for the first half of the month, overnight minimum temperatures stayed below freezing. By the end of the second week of February, warm conditions returned to the state. Lake Superior ice cover for early February is slightly above the historical average and is around 45% on February 11.
[see: DNR Conservation Officer Reports | 2024 Lake Ice-In Dates | Great Lakes Ice Cover]
Future prospects:
The February precipitation outlook has a tilt for above normal precipitation over the northern part of the state, with equal chances over the western part of the state. Precipitation normals range from near one-half inch of liquid equivalent in western Minnesota to just over three-quarter of an inch of precipitation in eastern sections of the state. The median snow depth at the end of February ranges from under five inches in southwest Minnesota to over 18 inches on the ground in northeastern Minnesota (greater than 30 inches in the Lake Superior highlands).
[see: Climate Prediction Center 30-day Outlook | February Precipitation Normal Map]The February temperature outlook that was issued on January 31, has a tendency for below normal temperatures over the entire state, especially over the eastern half. However, as of February 13, February 2026 will likely finish above normal for temperature. Normal February low temperatures range from near minus 10 degrees in the far north to the single digits above zero in southern Minnesota early in the month; ascending to the low single digits in the north, mid-teens in the south by the end of February.
[see: Climate Prediction Center 30-day Outlook | February Temperature Normal Map]The 90-day precipitation outlook for February through April indicates a tilt toward above normal precipitation for the north and eastern half of the state with equal chances of above, normal and below normal precipitation over southwest Minnesota with a slight tendency for above normal precipitation over the eastern US. .
[see: Climate Prediction Center 90-day Outlook]The National Weather Service produces long-range probabilistic river stage and discharge outlooks for the Red River, Minnesota River, and Mississippi River basins. These products address both high flow and low flow probabilities. Here are the current weather conditions impacting prospects for spring snow melt flooding:
Upper Mississippi and Minnesota River basins The Spring Flood threat is below normal due to the lack of significant snow pack and prevailing dry soil conditions. The potential for Spring flooding will be mainly reliant on future rainfall events rather than antecedent conditions.
A below normal snow pack for this time of year is the primary reason for the below normal spring flood outlook. Parts of the area are completely snow free at this time, while locations that do have snow have less than a usual winter.
Current River Levels -- River levels range from slightly above normal (upper Minnesota River) to below normal for early Spring due to the lower water levels as things froze earlier in the winter. The exception is portions of the upper Minnesota River, where precipitation in December and more recent melt have led to slightly higher than normal stream flows for this time of year. However, given the lack of overall snow pack, stream flows will likely become below normal for Spring in the coming weeks if significant precipitation does not occur.
Red River: The risk for significant (moderate or higher) spring flooding is low with this outlook issuance, running below long-term historical averages for most locations across the Red River Basin (US portion) Minor to isolated moderate spring flooding is forecast with this outlook issuance (50% exceedance probability).
Below normal precipitation last fall (with an especially dry November) allowed soils to dry out a bit before freeze-up. Snowfall/precipitation thus far this winter has been above normal for roughly the northern half of the basin while below normal across the south. Above normal temperatures to start the winter season has led to a relatively normal frost layer for this time of year (shallowest in the south while a bit deeper in the north). Below normal temperatures are expected to continue into spring which could lead to a delayed snow melt. Late winter and spring precipitation, along with the timing/thaw cycle of any snow pack will be the most important spring flood risk factors.
Rainy River Below normal outside of the far eastern headwaters.
Overall Risk of Spring Flooding in northeast Minnesota and northwest Wisconsin is normal to below normal. Largely below normal snow pack water should reduce spring flood risk, except along the South Shore in NW WI where above normal snow water may increase flood risk. [see: Spring Flood Outlook for Northeast MN and Northwest WI]
We still have quite a bit of winter to go, so there may be changes to the situation.
[see: National Weather Service - North Central River Forecast Center]
From the Author:
from Mark Seeley’s Weather Talk Martha Opjorden of Milan (Chippewa County) passed away on January 23, 2026 at age 75 years, and 4 days later her husband Luther Opjorden of Milan passed away at age 80 years. Luther and Martha were cooperative (volunteer) weather observers for the NOAA-National Weather Service at Milan since 1982. They had taken over daily weather observations at Milan from Luther’s father Torfinn, who had made daily observations since 1925. Before Torfinn’s tenure as climate observer, other members of the Opjorden family had made daily weather observers since 1893, helping to build a 132 year continuous daily climate record for Chippewa County. This is one of the most valuable long term climate records in the state of Minnesota.[see: Minnesota’s Weather Talk]
Upcoming dates of note:
![]() Subscribe to email announcements of the monthly posting of this product.
Subscribe to email announcements of the monthly posting of this product.
February 19: National Weather Service releases 30/90 day temperature and precipitation outlooks