

A monthly electronic newsletter summarizing Minnesota's climate conditions and the resulting impact on water resources. Distributed on the first Thursday of the month.
State Climatology Office - DNR Division of Ecological and Water Resources, St. Paul
distributed: July 9, 2026
What happened in June 2026:
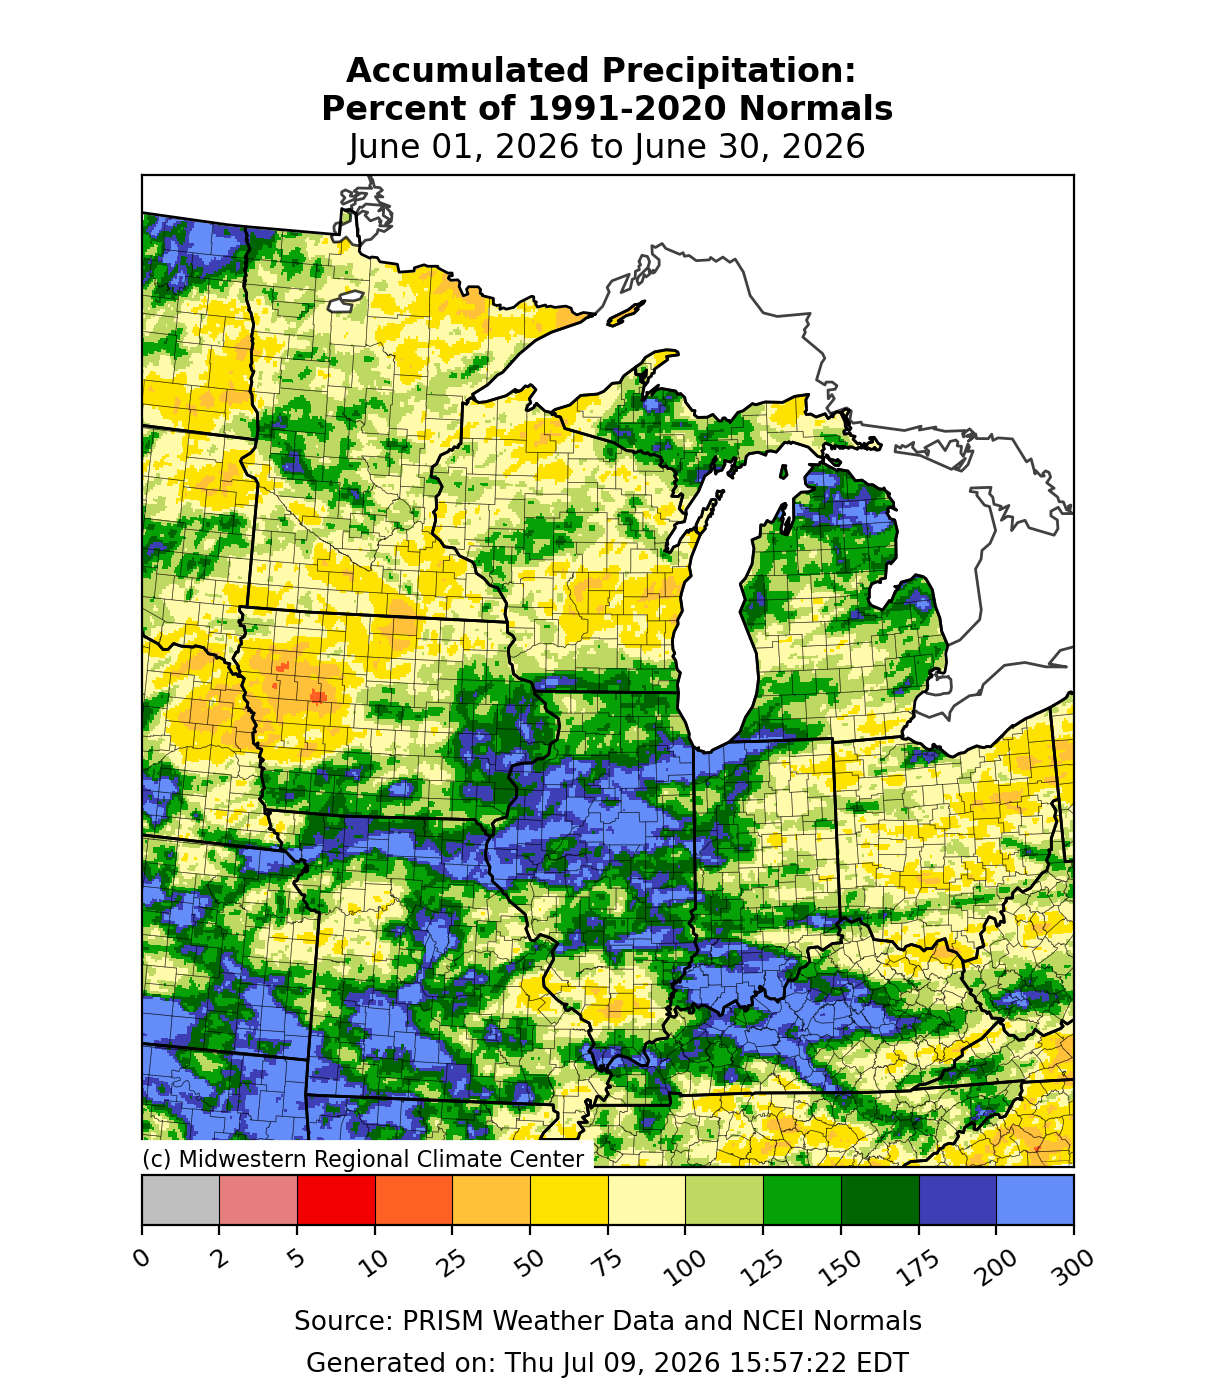
On average, June is our wettest month in the state. There were a wide range of precipitation totals for June 2026, ranging from above normal in the northwest, central and west central, with below average across the southwest and northeast. One of the wettest locations was Melrose in Stearns County with 6.60 inches, or 2.38 inches above normal. One of the drier locations was Orr in St. Louis County with1.79 inches of rain or 2.37 inches below normal. The statewide average precipitation was 4.03 inches or .57 inches below normal. [see: June 2026 Precipitation Total Map | June 2026 Precipitation Departure Map | June 2026 Climate Summary Table | June 2026 Percent of Normal Precipitation Map]
June 2026 was a fairly active month storm-wise with multiple days of storms, but there was also about a two-week stretch of pleasant weather in the middle as well. A warm and humid air mass interacted with an energetic weather pattern to produce multiple waves of heavy thunderstorms across Minnesota on June 9-10, 2026. Some of the storms produced wind damage and large hail.
[see: Steamy and Stormy, June 9-10, 2026 ]Isolated to scattered severe thunderstorm cells tracked across eastern Minnesota late in the afternoon on Friday, June 19, 2026, producing large hail and some gusty winds.[see: North Metro Hail Burst, June 19, 2026]
The last severe storm event of the month was on Monday June 29, 2026. This event began with heavy thunderstorms tracking through northeastern Minnesota. One batch of storms regenerated for several hours near the shore of Lake Superior, leading to excessive rainfall. Around 9 AM, a large and damaging storm that had tracked across South Dakota for over six hours entered far western Minnesota. This storm had been highly destructive in South Dakota in the early morning, where measured wind gusts up to 131 mph snapped large wind turbines and produced extreme, tornado-like damage.
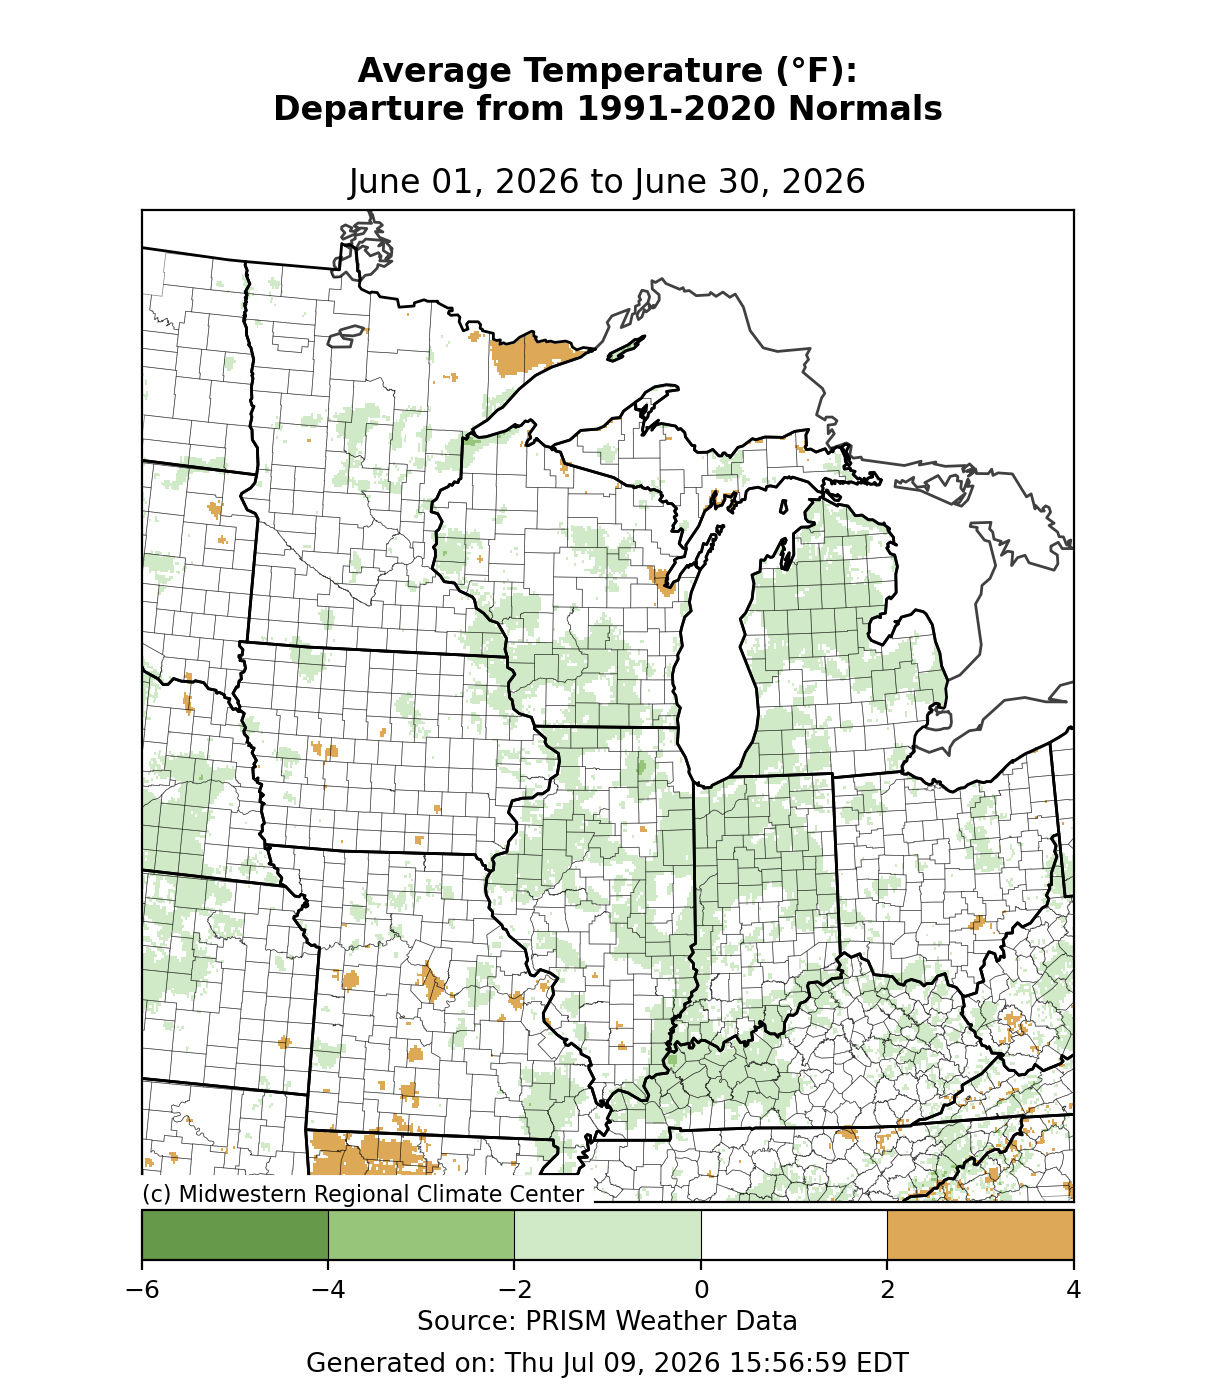
[see: Heavy Rain and Tornadoes, June 25-26, 2026]June 2026 was warm but also had some pleasant temperatures as well. The preliminary average temperature was nearly the same as June 2025, 66 degrees or .5 degrees above normal. There was a lack of extremely hot days. The warmest temperature found was 94 degrees at Forest Lake on June 30 in east central Minnesota and the coldest temperature found was at Celena on June 19, where the mercury dipped to 32 degrees.
[see: June 2026 Climate Summary Table | 2026 June Departure from Normal Temperature Map]


Where we stand now:
Seasonal precipitation so far (April 1 through July 7) shows that far southeastern Minnesota is the wettest area of the state with 125% to 150% of normal precipitation, with the driest locations in the north central and west, with some areas well short of historical averages, with some north central areas about 50% of normal.
[see: Seasonal Precipitation Maps]On July 8, 2026 25% of the state was free of any drought designation, compared to 63% this time last year. 46% of the state has Abnormally Dry conditions, with 18% of the state having Moderate Drought conditions, and 11% of the state in Severe Drought conditions. The U.S. Drought Monitor index is a blend of science and subjectivity where drought categories (Moderate, Severe etc.) are based on several indicators.
[see: Drought Conditions Overview]The U.S. Geological Survey reports that stream discharge levels on July 9 vary widely across the state ranging from extremely below normal over the far north central part of the state, to extremely above normal over parts of the southeast. Must of the rest of the state is normal to above normal conditions, with a few locations in the west with below normal conditions. In general, streamflows have improved over the past couple of weeks, except in the far north.
[see: Cooperative Stream Gauging | USGS Stream Flow Conditions]Water levels on most Minnesota lakes vary depending on lake and location in the state. On July 9, Mille Lacs was at 11.09 feet, about half a foot below the median. The level on Lake Minnetonka on June 29 was at 929.15 feet with 20 cfs flowing through Grey’s Bay Dam. On July 9, White Bear Lake was at 923.07 feet, about a tenth of a foot lower than this time last year. The lake level of Lake of the Woods was trending lower for early July with the elevation on the lower end of the median band. Lake Superior was forecast to be 601.93 feet for July 2026, about two tenths of a foot higher than the long term (1918-2025) average.
[see: Mille Lacs Lake Water Level | Lake Minnetonka Water Level | White Bear Lake Water Level | Lake of the Woods Control Board Basin Data | Corps of Engineers Great Lakes Water Levels]The Agricultural Statistics Service on July 6 reported that topsoil moisture across Minnesota is 2 percent Very Short, 17 percent Short, 73 percent Adequate, and 8 percent Surplus. Soil moisture levels at Lamberton on July 1 were very close to historic averages for the time of year.
[see: Agricultural Statistics Service Crop Progress and Condition | U. of M. Southwest Research & Outreach Center (Lamberton) | 2011-2018 Lamberton Soil Moisture Graphs ]Timely rains for the summer of 2026 so far has eased the fire danger, but drier conditions are returning. The potential for wildfires is currently rated by DNR Forestry as Low across the central and south, with Moderate fire danger in the northwest and also some High fire danger in the northeast.
[see: Fire Danger Rating Map]
Future prospects:
The July precipitation outlook has a tilt for below normal precipitation over the central and northern parts of the state, with equal chances of below, above and normal precipitation. July precipitation normals range from just under three inches in northwest Minnesota to about five inches in southeastern counties.
[see: Climate Prediction Center 30-day Outlook | July Precipitation Normal Map]The Climate Prediction Center’s Outlook for July has equal chances for below, normal and above normal temperatures for not only Minnesota, but the entire upper Midwest as well. Normal July high temperatures are in the 80s in the south and the upper 70s in the north. Normal July low temperatures are in the 50s in the north, and in the 60s in the south.
[see: Climate Prediction Center 30-day Outlook ]The 90-day precipitation outlook (July-September) for Minnesota has a tilt for below normal precipitation in the northeast, with a tendency for below normal temperatures in the southeast. What does the winter of 2026-26 hold? The preliminary outlook for this winter has a fairly strong chance for above normal temperatures and a three-sided dice of below, normal and above normal precipitation, with a tilt for perhaps a direr winter in the far northeast and northeast. [see: Climate Prediction Center 90-day Outlook | Meteorological Winter 2026-27]
From the author:
An area of stalled, slow-moving, and regenerating heavy thunderstorms from late on Wednesday July 1 into Thursday July 2, 2026, produced dangerous flash flooding across southeastern Minnesota.[see: Mega-Rain and Flash Flood, July 1-2, 2026]
Upcoming dates of note:
July 16: National Weather Service releases 30/90-day temperature and precipitation outlooks