A monthly electronic newsletter summarizing Minnesota's climate conditions and the resulting impact on water resources. Distributed on the first Thursday of the month.State Climatology Office - DNR Division of Ecological and Water Resources, St. Paul
Distributed: March 9, 2022
[see: National Weather Service – Covering Red River and Devils Lake Basin]
[see: National Weather Service - North Central River Forecast Center] Subscribe to email announcements of the monthly posting of this product.
Distributed: March 9, 2022
What happened in February 2022:
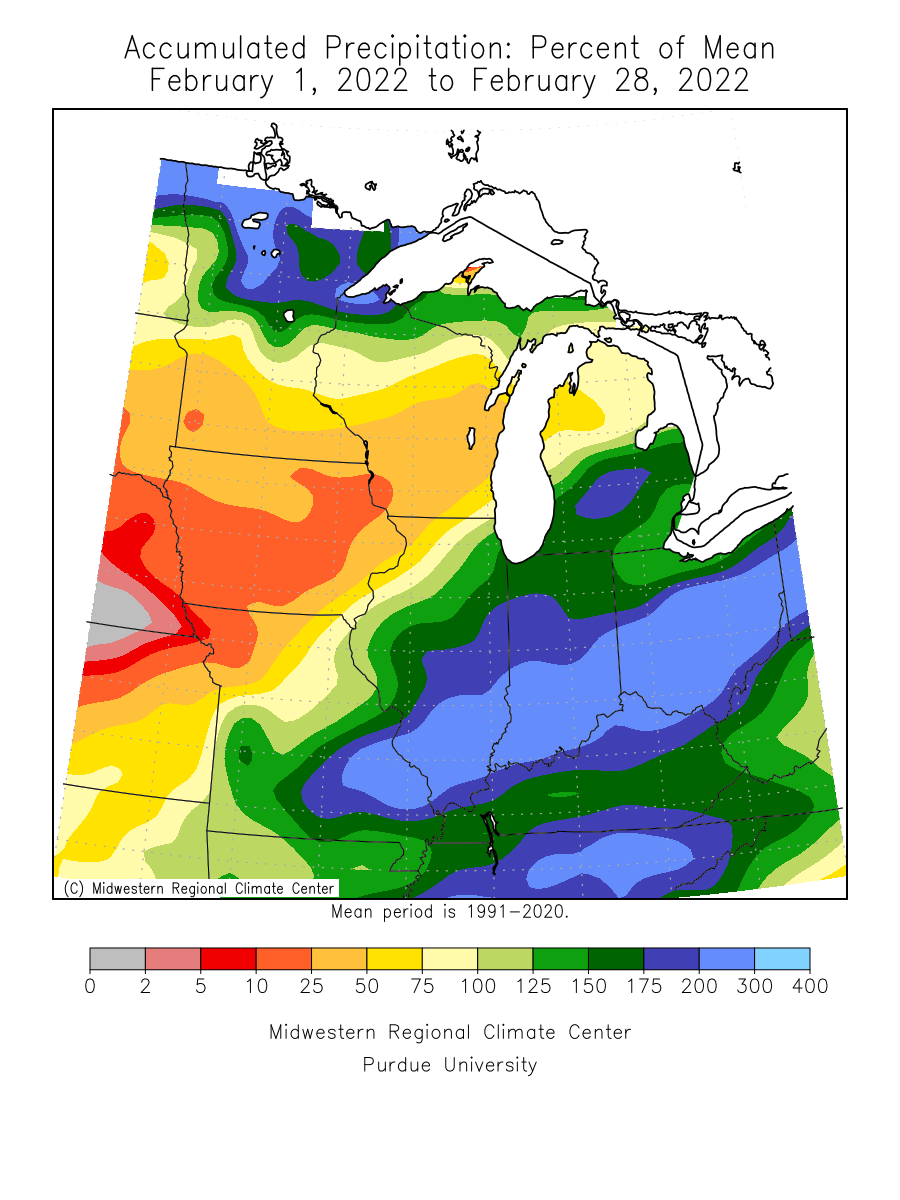
- February is on average the driest month of the year. Normal precipitation is generally less than an inch for most locations. Precipitation for February 2022, was generally below normal in the south, near normal in the central and above normal in the north. Much of the liquid was associated with low snow water content events. One of the higher monthly precipitation totals found was seven miles northwest of Two Harbors with 1.98 inches or .72 inches above normal. Precipitation in the Red River Valley was near to well above average especially in the far northwest part of Minnesota. Just across the border at Pembina in North Dakota, the precipitation total was 2.03 inches or 1.64 inches above normal. The preliminary state average for Minnesota was .67 inches or .24 inches below normal.
[see: February 2022 Precipitation Total Map | February 2022 Precipitation Departure Map | February 2022 Climate Summary Table | February 2022 Percent of Normal Precipitation Map] - The active northwest wind flow pattern from January continued into February and brought a plethora of Albert Clippers.
- One example was the clipper event from February 10 that brought the typical roller-coaster temperatures, along with a burst of snow and bitterly cold temperatures. Warm air surged behind a warm front on February 10, and temperatures rose to the upper 30s to the low 40s over much of western and central Minnesota. The February thaw was short-lived. The cold front with the clipper swept across Minnesota during the overnight and early morning hours of the 11th and brought with it rain, sleet and snow and a full-fledged blizzard in northwest Minnesota. I-94 was closed from Fargo to Fergus Falls during the morning hours of the 11th. Temperatures plunged in the wake of the front and fell 48 degrees in 24 hours from 39 degrees to -8 at Hallock. Snowfall totals were in the half inch to three inch range for the most part. International Falls had 3.5 inches, Grand Forks had 3.4 inches, Duluth saw 2.9 inches and the Twin Cities had .6 (six tenths) of an inch. Some peak wind gusts were to 58mph at Fargo, 54mph at Grand Forks and 44mph in the Twin Cities.
[see: Another Day, Another Clipper: February 10-11, 2022] - Not all the snow events were with clippers. A large and windy winter storm affected Minnesota on February 21 and 22. The 2-day storm produced a large blanket of snow across Minnesota with an inch or more covering virtually the entire state, about 2/3 of the state receiving at 2 inches or more, a third receiving at least 6 inches, and about 15% of the state receiving 10 inches or more. The highest totals from National Weather Service cooperative observers or from CoCoRaHS include 20 inches on Park Point in Duluth and 18 inches at Little Falls The Duluth National Weather Service officially recorded 10.4 inches, and the Twin Cities International Airport received 5.1 inches of snow.
[see: Snowstorm, February 21-22, 2022] - The winter in general was noted for the high number of blizzard warnings for the Red River valley area. As of the first week of March, the Grand Forks National Weather Service has issued 11 separate Blizzard Warnings for the 2021-22 winter, tying the most on record in the searchable database back to 2005.
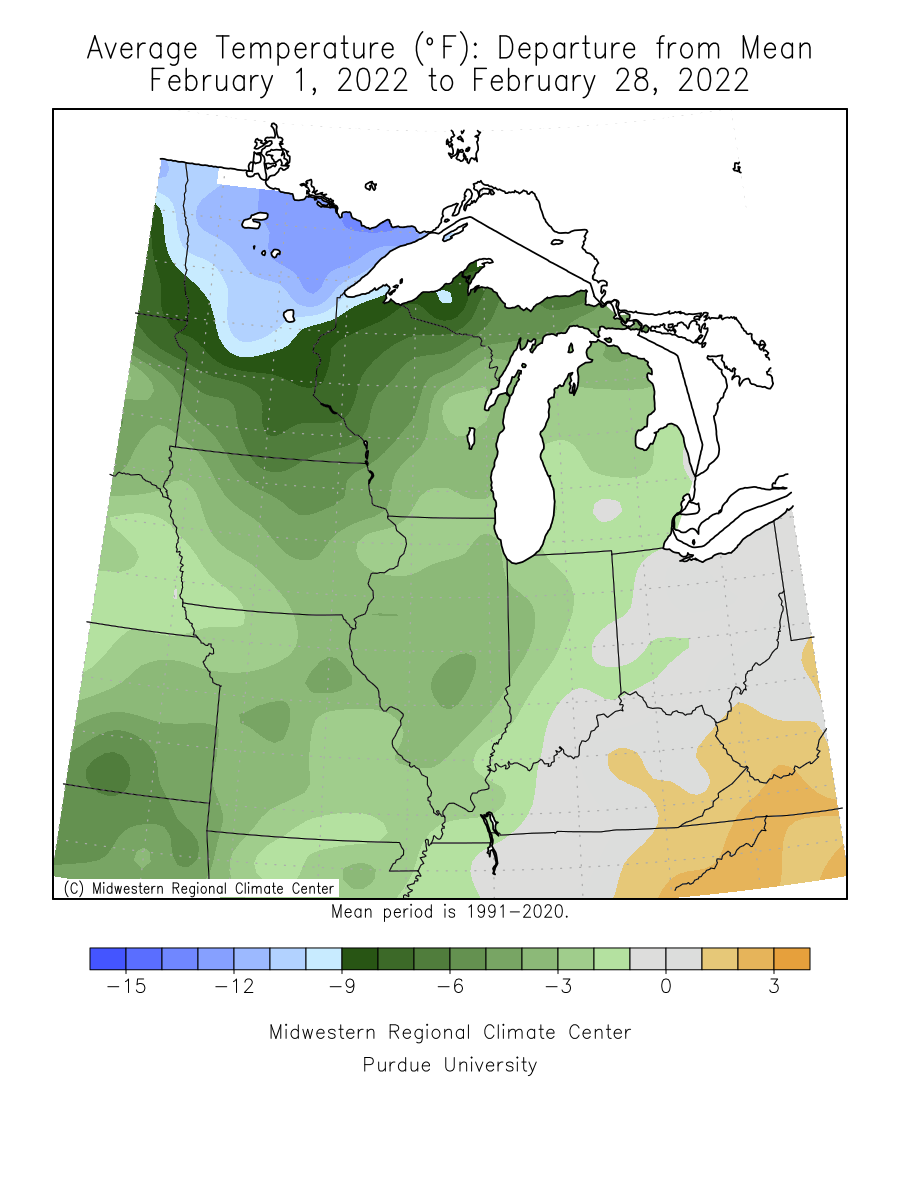
[see: Winter of Whiteouts in Northwestern Minnesota] - February 2022 was the second month in a row with below normal temperatures. The preliminary average statewide temperature was 9.0 degrees or 6.8 degrees below normal. International Falls had its seventh coldest February on record and the 14th coldest at Duluth. The coldest temperature found in February 2022 was -44 degrees F on February 14 and 15 at Kabetogama and the warmest temperature was 56 degrees on February 8 at Lakefield and on February 28th at Worthington in southwest Minnesota, where snow cover was scant for the month. Statewide, the past ten Februaries statewide back to 2013 eight have been below normal and only two were above normal (2016 and 2017).
[see: Minnesota Climate Trends | February 2022 Climate Summary Table | 2022 February Departure from Normal Temperature Map]
Where we stand now:
- The snow depth ranking for March 3 really depicts the “have’s and “have-nots.” There was virtually no snow cover remaining over southwest and south central Minnesota. The snow depth contours rapidly increase as one moves north. One to two feet of snow is one the ground from Traverse though Morrison County eastward to Pine County. Much of the northern part of the state is in the 80 to 80th percentile. A large swath from Douglas though Otter tail to Becker County is in the 95th percentile.
[see: Weekly Snow Depth and Ranking Maps | NWS Snow Depth Estimation Map | Midwest Regional Climate Center Snow Depth Map] - The U. S. Drought Monitor map released on March 3, 2022 depicts 43% of Minnesota with no drought designation. The last time the state was this free of drought was on May 18, 2021. Last year at this time there was some level of drought designation in the state. About 57% of the state was Abnormally Dry, and 27% of the state in Moderate Drought conditions. Two areas in north central and northeast Minnesota have Severe Drought conditions. The U.S. Drought Monitor index is a blend of science and subjectivity where drought categories (Moderate, Severe, etc.) are based on several indicators.
[see: Drought Conditions Overview] - The U.S. Geological Survey reports that stream discharge values (where winter measurements are possible) are normal to above the historical median for the date for the few Minnesota rivers that have data, mostly in the central and southeast.
[see: USGS Stream Flow Conditions] - In their final report of the 2021 growing season (November 28), the Agricultural Statistics Service reported that topsoil moisture across Minnesota was 2 percent Very Short, 11 percent Short, 80 percent Adequate, and 5 percent Surplus. History has shown that soil moisture conditions observed in the late autumn are indicative of conditions to be expected when the soil thaws. Soil moisture readings at Waseca and at Lamberton finished above the historical median for the final report for 2021. Soil temperatures at the U of M St. Paul Campus Climate Observatory have stayed just under 32 degrees at the four inch depth under sod since early January.
[see: Agricultural Statistics Service Crop Progress and Condition | U. of M. Southwest Research & Outreach Center (Lamberton) | U. of M. Southern Research & Outreach Center (Waseca)] - The potential for wildfires is currently rated by DNR Forestry as Low across the entire state.
[see: Fire Danger Rating Map] - Frost depths are fairly deep over southern Minnesota and range from 14 inches at Lamberton, 23 inches at Waseca and 23 inches at St. Paul. The deepest frost is 42 inches at Watson in Chippewa County. The frost is shallower under the deep snow cover in central Minnesota and is eight inches at Long Prairie in Todd County. Typically the maximum frost depth occurs near the end of February.
[see: National Weather Service Frost Depth Data | MnDOT Road Frost Depths | Minnesota Department of Agriculture Six-Inch Soil Temperature Network ] - Minnesota lakes and wetland complexes continue to be ice covered, but some streams in the southeast are opening up. The median date for lake ice to leave lakes in far southern Minnesota is late March. Lake and river ice is never completely safe. Ice cover on Lake Superior has generally been above the 1973-2021 median for the past two weeks. On March 3, 2022 64% of Lake Superior was ice covered. The maximum ice coverage for Lake Superior typically happens in late February.
[see: DNR Conservation Officer Reports | Median Lake Ice-Out Dates | Great Lakes Ice Cover]
Future prospects:
- The March precipitation outlook has a slight tilt for above normal precipitation for much of the state, except the west central and the northwest. These areas will equal chances for below normal and above normal precipitation for all but the northeast. Historically, average March precipitation totals range from near three-quarters of an inch in northwestern Minnesota to around two inches in southern sections of the state. March is a transition month when cold, dry continental air masses are gradually replaced by warm, moist air on a more frequent basis. This is demonstrated by the fact that March's normal precipitation is 50 percent higher than February's normal precipitation, the greatest percentage increase between any two successive months.
[see: Climate Prediction Center 30-day Outlook | March Precipitation Normal Map] - The March temperature outlook indicates a tendency for below normal temperatures. Normal March high temperatures climb from near 30 degrees early in the month to the low to mid-40s by month's end. Normal March lows begin the month in the single digits above zero in the far north and mid-teens in the south. By late March, normal lows are in the low 20s in the north, near 30 in the south.
[see: Climate Prediction Center 30-day Outlook | March Temperature Normal Map] - The 90-day precipitation outlook for March through May indicates equal chances for below, normal and above normal precipitation across the state. The March through May temperature projection indicates a slight tilt for above normal temperatures except for the northeast.
[see: Climate Prediction Center 90-day Outlook] - The National Weather Service produces long-range probabilistic river stage and discharge outlooks for the Red River, Minnesota River, and Mississippi River basins. These products address both high flow and low flow probabilities. Here are the current weather conditions impacting prospects for spring snow melt flooding:
- As February 24, the snow water equivalent on the landscape was close to zero in the southwest, near average in the central part of the state, and above average in the north. Due to the increased snowpack in the north, the risk of significant snowmelt flooding is moderately high, running somewhat above long term historical averages for the Red River basin. The current flood outlook for the Mississippi, Minnesota and St. Croix fiver is average or near normal. There is a slight increase in probability of minor flooding on the Mississippi and northern tributaries.
[see: National Weather Service – Covering Red River and Devils Lake Basin]
[see: National Weather Service - North Central River Forecast Center]
From the author:
- The Meteorological Winter (December-February) of 2021-22 finished colder than normal, with a cold January and February more than making up for an overall fairly mild December. In general, the 2021-22 winter finished 2.0 degrees below normal F in Rochester, 3.0 degrees below normal in the Twin Cities, and 5.5 degrees below normal F at International Falls. Snowfall was generally above normal, except for places in the south.
Upcoming dates of note:
- March 17: National Weather Service releases 30/90 day temperature and precipitation outlooks
Pete Boulay, DNR Climatologist