A monthly electronic newsletter summarizing Minnesota's climate conditions and the resulting impact on water resources. Distributed on the first Thursday of the month.
State Climatology Office - DNR Division of Ecological and Water Resources, St. Paul
distributed: November 5, 2021
What happened in October 2021:
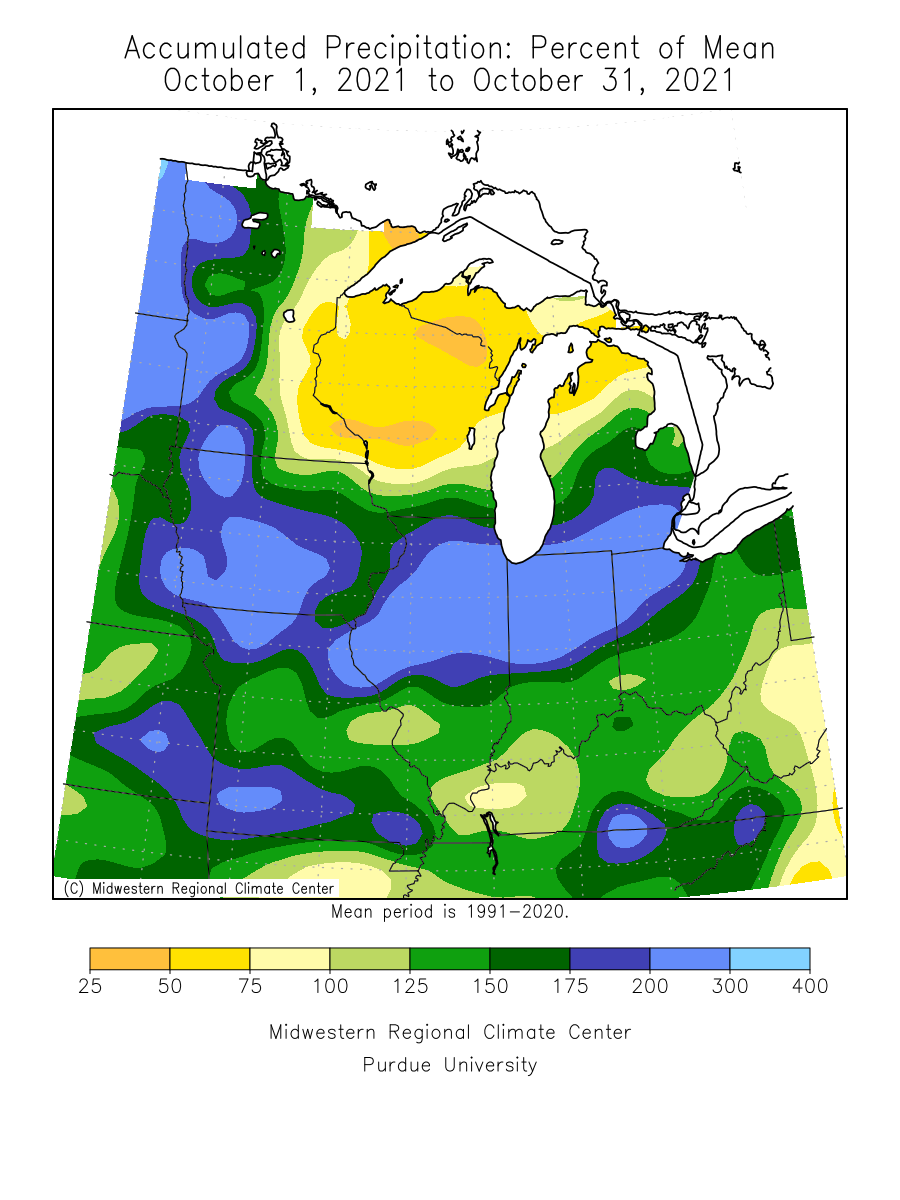
- October 2021 finished above normal in precipitation statewide, with wide variations. The preliminary statewide average precipitation was 3.04 inches or .42 inches above normal. The wettest locations were in western Minnesota with Artichoke Lake in Big Stone County finishing with 7.60 inches of precipitation or 5.30 inches above normal. Eastern Minnesota finished below normal in general for precipitation. The southeast and the northeast had the largest departures with about one inch to an inch and a half below normal. Grand Marias finished about two inches short of normal with .99 inches of precipitation. More areas in the state saw a surplus compared to last October. October 2020 was drier and the statewide average was .70 inches below normal. Another difference from October 2020 is that virtually all the precipitation in October 2021 fell in the liquid form, compared to the multiple snow events of last October.
[see: October 2021 Precipitation Total Map | October 2021 Precipitation Departure Map | October 2021 Climate Summary Table | October 2021 Percent of Normal Precipitation Map] - It was an active severe weather month for October. The first event was a squall line that developed over northeast South Dakota and moved into north central Minnesota with a tornado touching down and causing damage in Park Rapids.
[see: Review of the October 9th, 2021 Severe Weather Event] - On Sunday, October 10th, a rather strong tornado plowed through a swath of the Superior National Forest in Cook County, making it Minnesota's farthest-northeast tornado known to have occurred so late in the season.
[see: Unusual October Boundary Waters Tornado, October 10th, 2021] - October 2021 continued the streak of above normal temperatures that began in March 2021. The preliminary state average October 2021 temperature was 52.2 degrees, six degrees warmer than normal and more than ten degrees warmer than October 2020, which finished as the fifth coldest statewide back to 1895. October 2021 ranked in the top ten warmest for many locations in the state, with the first half of the month being exceptionally warm. The last week of the month had some below normal temperatures with a killing frost, even in the Twin Cities on October 23. The highest temperature for the month was 89 degrees at Theilman on October 1 and the coldest reading found was 16 degrees at Hibbing on October 24.
[see: October 2021 Climate Summary Table | 2021 October Departure from Normal Temperature Map]
Where we stand now:
- Seasonal precipitation totals (April 1 through November 2) ranked above the historical median over parts of the west central, parts of the southwest and far southeast. Some areas in the northwest are near the median, but the majority of the state was ranked in the 40th percentile or less. Large sections of northern Minnesota are in the 20th percentile or less.
[see: Seasonal Precipitation Ranking Maps] - The U. S. Drought Monitor map released on November 4, depicts areas of drought that have been reduced in intensity since last month. 23% of the state is free of any drought. 21% of the state in the Abnormally Dry category, 27% in the Moderate Drought category, 23% in the Severe Drought category and 7% in the Extreme Drought category. The U.S. Drought Monitor index is a blend of science and subjectivity where drought categories (Moderate, Severe, etc.) are based on several indicators.
[see: Drought Conditions Overview] - The U.S. Geological Survey reports that stream discharge values are much above normal in the west central, normal to above normal in the western part of the state, to below normal to near normal in the east central. Stream flow readings are below normal to much below normal in the north central and northeast.
[see: USGS Stream Flow Conditions] - Water levels on most Minnesota lakes vary depending on lake and location in the state. Mille Lacs was well below the median lake level for early November and has fallen about two foot over the co 2020. On November 6, Minnetonka was at 928.06 feet, falling a little over a foot since May 2021. The Gray’s Bay Dam closed on July 21. White Bear Lake was at 923.27 feet on November 5, a fall of .88 feet from one year ago. Rainy Lake is in the median range and Lake of the Woods is below the 10th percentile for early November. Lake Superior was forecasted to be at 601.77 feet on November 5, two inches lower than the monthly average for November and eleven inches lower than the same time last year.
[see: Mille Lacs Lake Water Level | Lake Minnetonka Water Level | White Bear Lake Water Level | Lake of the Woods Control Board Basin Data | Corps of Engineers Great Lakes Water Levels] - The Agricultural Statistics Service on November 1 reports that topsoil moisture across Minnesota is 4 percent Very Short, 16 percent Short, 71 percent Adequate, and 9 percent Surplus. Soil moisture levels at Lamberton on November 1 are above historic averages and are the highest seen in at least five years. Waseca’s fall readings have also recovered from the summer dryness.
[see: Agricultural Statistics Service Crop Progress and Condition | U. of M. Southwest Research and Outreach Center (Lamberton) | U. of M. Southern Research and Outreach Center (Waseca)] - The potential for wildfires on November 6, 2021 is currently rated by DNR Forestry as Low across much of Minnesota, and Moderate in west central Minnesota. Historically, 80 percent of all wildfires in Minnesota occur during April and May.
[see: Fire Danger Rating Map]
Future prospects:
- The November precipitation outlook leans towards equal chances of above, normal and below normal precipitation, except in the far northeast that has a slight tilt for above normal precipitation. November precipitation normals range from about three-quarters of an inch in northwest Minnesota to about two-and-a-half inches in Cook County. Southern and central Minnesota range by about one-and-a-quarter of an inch in the southwest to about two-inches and a quarter in south central Minnesota.
[see: Climate Prediction Center 30-day Outlook | November Precipitation Normal Map] - The November temperature outlook has a tendency for above normal temperatures in the northeast and equal chances for above normal and below across the rest of the state. Normal November high temperatures are in the 40s to start the month, dropping to the 30s by month's end. Normal lows are in the 30s to upper 20s early in the month, falling to the teens by late November.
[see: Climate Prediction Center 30-day Outlook | November Temperature Normal Map] - The 90-day temperature outlook for November through January has equal chances of above below and normal temperatures, with a slight edge to above normal temperatures in the southeast. Precipitation also has equal chances for above normal and below normal precipitation with a tendency of above normal precipitation in the far northeast.
[see: Climate Prediction Center 90-day Outlook] - The National Weather Service produces long-range probabilistic river stage and discharge outlooks for the Red River, Minnesota River, and Mississippi River basins. These products address both high flow and low flow probabilities.
[see: National Weather Service - North Central River Forecast Center]
From the author:
- Rain events in September and October 2021 improved the drought situation, especially in the southwest and west central where drought was eliminated. By November 2, 23% of the state was no longer under a drought designation. Extreme Drought continued in parts of the north central and the northeast. While in general, ground moisture improved as well as streamflow, the long term precipitation deficit continued and water levels in lakes had yet to recover. [see: The Drought of 2021]
- For the second winter in a row, La Niña conditions are forecast to be present. The Winter Outlook (December-February) from the Climate Prediction Center has equal chances for below above and normal temperatures over the east and a tilt for above temperatures over the southeast. The precipitation outlook is for a tendency for above normal precipitation in the northwest and equal chances for above normal and below normal precipitation over the rest of the state. [see: Climate Prediction Center December-February Outlook]
Upcoming dates of note:
- November 18: National Weather Service releases 30/90 day temperature and precipitation outlooks
![]() Subscribe to email announcements of the monthly posting of this product.
Subscribe to email announcements of the monthly posting of this product.
Pete Boulay, DNR Climatologist