A monthly electronic newsletter summarizing Minnesota's climate conditions and the resulting impact on water resources. Distributed on the first Thursday of the month.
State Climatology Office - DNR Division of Ecological and Water Resources, St. Paul
distributed: October 13, 2022
What happened in September 2022:
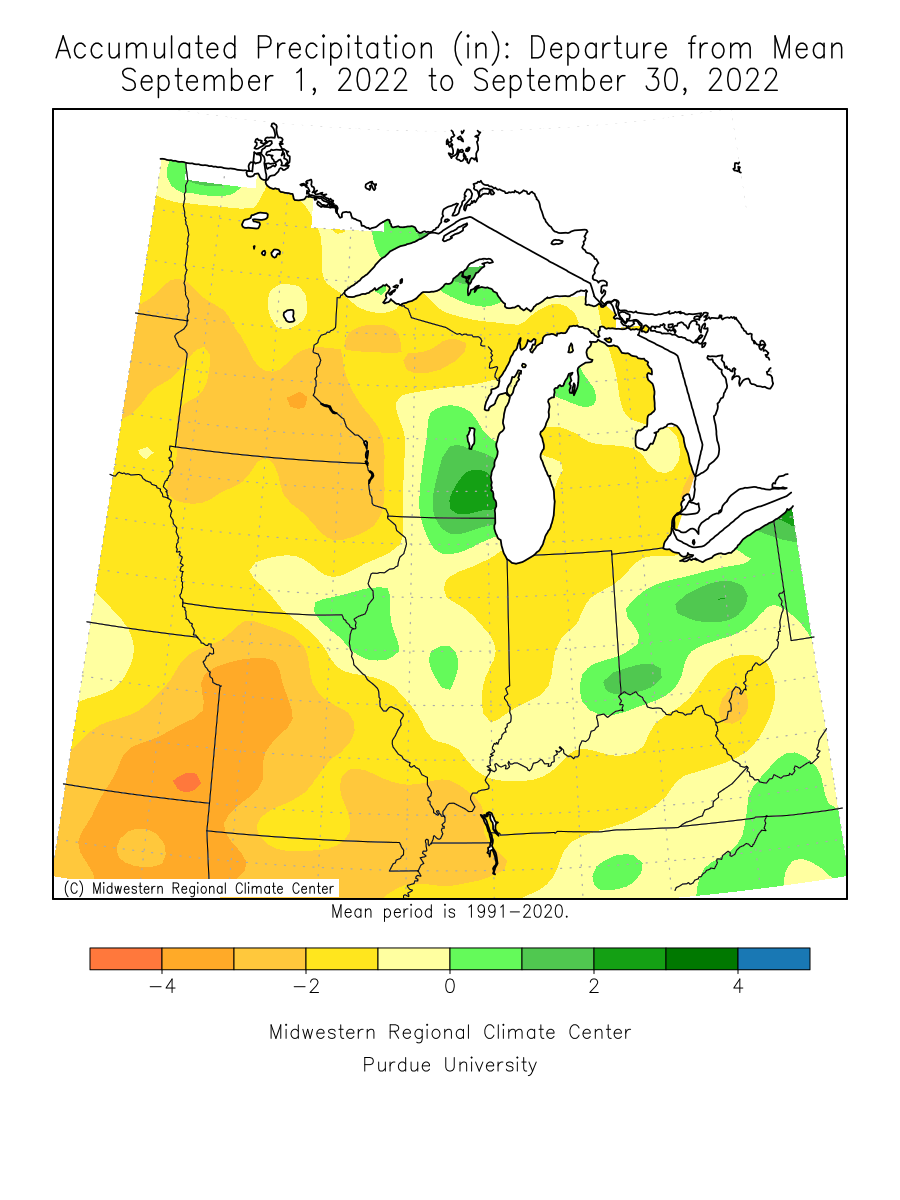
- Precipitation in September 2022 finished well below normal state-wide, with very few locations seeing above normal precipitation. The preliminary average for Minnesota was 1.29 inches or 1.97 inches below normal. The greatest departures from normal were in the southeast part of the state. A small area centered in eastern Marshall County in northwest Minnesota finished above normal for precipitation, along with the northeast tip of Cook County. The Twin Cities saw its driest September on record, with a scant .24 inches, or 2.78 inches below normal. One of the wettest locations was Grand Portage in far northeast Minnesota that finished with 5.04 inches or 1.91 inches above normal.
[see: September 2022 Precipitation Total Map | September 2022 Precipitation Departure Map | September 2022 Climate Summary Table | 2022 September Departure from Normal Precipitation Map - September 2022 had one severe storm episode of note for the month:
- On September 20, after an afternoon of high heat with 80s and even 90s in the state, a cold front plowed through the region in the early evening and spawned severe thunderstorms. Large hail to ping-pong ball size fell in the northeast metro, with larger hail to baseball-size over the River Falls Wisconsin area.
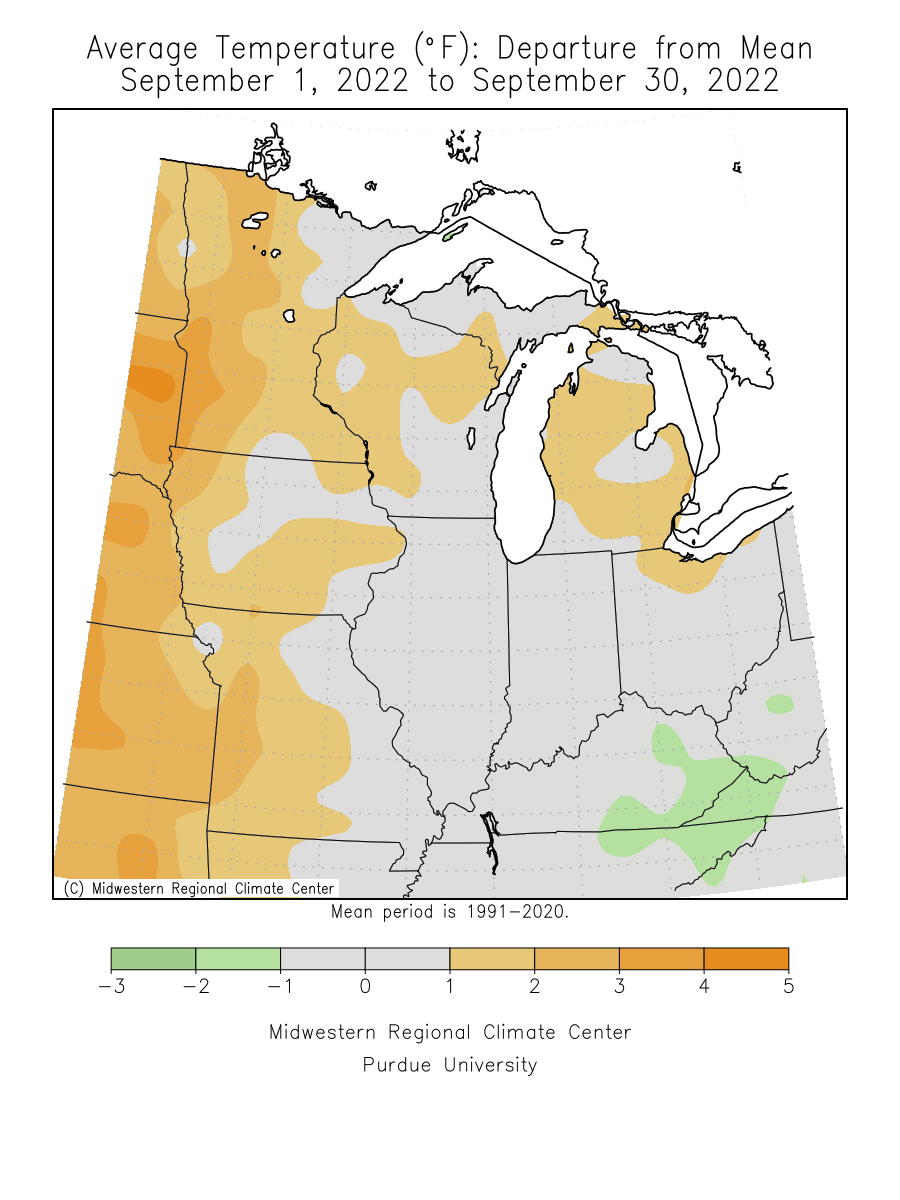
[see: Record Heat and Large Hail in the Twin Cities, September 20,2022] - For the 5th month in a row, September continued the warm streak of months that began in May 2022 and finished well above normal statewide. The preliminary average statewide temperature was 1.7 degrees above normal. The warmest temperature found in the state so far was 99 degrees F at Lamberton in Redwood County on the 20th (reported on the 21st). The coldest temperature was 21 degrees at Brimson in St Louis County on the 28th and the 29th. Many locations in central and southern Minnesota saw a killing frost on September 28, very close to historical averages. Frost was late though in the north, with International Falls seeing its first temperature below 32 degrees on September 27.
[see: September 2022 Climate Summary Table | 2022 September Departure from Normal Temperature Map]
Where we stand now:
- Seasonal precipitation totals (April 1 through October 11) in general ranked below the historical median over the south and above the historical median in the north, with a mosaic of above and below in the central part of the state. A swath from the Twin Cities to southwest Minnesota was ranked below the 25th percentile. An area of north central Minnesota was ranked in the 95th percentile. Most of the rest of the state is ranked below the 40th percentile. South central and a large part of northern Minnesota is ranked in the 20th percentile or less.
[see: Seasonal Precipitation Ranking Maps] - The U. S. Drought Monitor map released on October 13, depicts drought intensity that has continued to increase over the past three months. 21% of the state is free of any drought. 43% of the state in the Abnormally Dry category, 24% in the Moderate Drought category, 8% in the Severe Drought category and 4% in the Extreme Drought category. The U.S. Drought Monitor index is a blend of science and subjectivity where drought categories (Moderate, Severe, etc.) are based on several indicators.
[see: Drought Conditions Overview] - The U.S. Geological Survey reports that stream discharge levels have slowly fallen over the past month for the entire state. Stream flows are generally normal to below normal in the state with some exceptions. Stream flows in west central Minnesota are above normal, much above normal and even high in northern Lac Qui Parle County. There are much below normal stream flows in the Twin Cities metro area, excluding the Minnesota and the Mississippi River and a few stream flow measurements were classified as much below normal.
[see: USGS Stream Flow Conditions | Weekly Stream Flow Maps and Tables] - Water levels fell on lakes in general during the summer and into autumn. Mille Lacs was about a half foot below median lake level for early October. On October 12, Minnetonka was at 929.64 feet, about six-tenths of a foot lower than this time last year. The Grays Bay Dam has been closed since July 20. White Bear Lake was at 922.69 feet on October 12, a fall of about eight tenths of a foot from one year ago. Rainy Lake and Lake of the Woods were both in the normal band for early October. Lake Superior was at 602.43 feet on October 7, four inches higher than the average October level and five inches higher than the water level from October 7, 2021.
[see: Mille Lacs Lake Water Level | Lake Minnetonka Water Level | White Bear Lake Water Level | Lake of the Woods Control Board Basin Data | Corps of Engineers Great Lakes Water Levels] - The Agricultural Statistics Service on October 11 reports that topsoil moisture across Minnesota is 10 percent Very Short, 34 percent Short, 54 percent Adequate, and 2 percent Surplus. 92% of the corn crop was mature, and 14% was harvested for grain, two days behind the five year average. 63% of soybeans were harvested, five days behind last year and one week ahead of the five average. Soil moisture levels at Lamberton are now at their lowest levels for early October since 2013 at 1.91 inches. There is virtually no moisture in the top two feet of the profile.
[see: Agricultural Statistics Service Crop Progress and Condition | U. of M. Southwest Research and Outreach Center (Lamberton) | U. of M. Southern Research and Outreach Center (Waseca)] - The potential for wildfires as of October 12 rated by DNR Forestry as Low across east central and northeast Minnesota, Moderate across northwest and west central Minnesota, High over southeast Minnesota, and Very High over southwest and south central Minnesota. Historically, 80 percent of all wildfires in Minnesota occur during April and May.
[see: Fire Danger Rating Map]
Future prospects:
- It looks like the five month warm pattern will continue for October, with dry conditions persisting.. October precipitation normals range from about one-and-a-half inches in northwest Minnesota to about three-and-a-half inches in Cook County. Southern and central Minnesota range by about one-and-three-quarters of an inch in the southwest to about two-and-a-half inches in east central Minnesota.
[see: Climate Prediction Center 30-day Outlook | October Precipitation Normal Map] - The October temperature outlook has a strong tendency for above normal temperatures throughout Minnesota for October, especially in the southwest. Normal October high temperatures are in the 60s to start the month, dropping to the low 50s to upper 40s by month's end. Normal lows are in the 40s early in the month, falling to the 30s by late October.
[see: Climate Prediction Center 30-day Outlook | October Temperature Normal Map] - The 90-day temperature outlook for October through December has a three-sided coin of equal chances of above, normal and below normal temperatures. The 90-day precipitation outlook for October through December indicates equal chances of below-normal, near-normal, or above-normal conditions across most of Minnesota.
[see: Climate Prediction Center 90-day Outlook] - The Outlook for December 2022-February 2023 has a tilt for below normal temperatures in Minnesota mainly for the latter part of the winter.
[see: Climate Prediction Center December-January Outlook] - The National Weather Service produces long-range probabilistic river stage and discharge outlooks for the Red River, Minnesota River, and Mississippi River basins. These products address both high flow and low flow probabilities.
[see: National Weather Service - North Central River Forecast Center]
From the author:
- Unlike the drought of 2021, where the drought of 2022 is focused from the Twin Cities to southwest Minnesota. Precipitation deficits since June 1 were nearly ten inches at Lamberton and the Twin Cities. This will be the third year in a row where the Twin Cities precipitation total will fall below the normal annual precipitation of 31.62.
Upcoming dates of note:
- October 20: National Weather Service releases 30/90 day temperature and precipitation outlooks
![]() Subscribe to email announcements of the monthly posting of this product.
Subscribe to email announcements of the monthly posting of this product.
Pete Boulay, DNR Climatologist