

A monthly electronic newsletter summarizing Minnesota's climate conditions and the resulting impact on water resources. Distributed on the first Thursday of the month.
State Climatology Office - DNR Division of Ecological and Water Resources, St. Paul
distributed: October 8, 2026
What happened in September 2026:
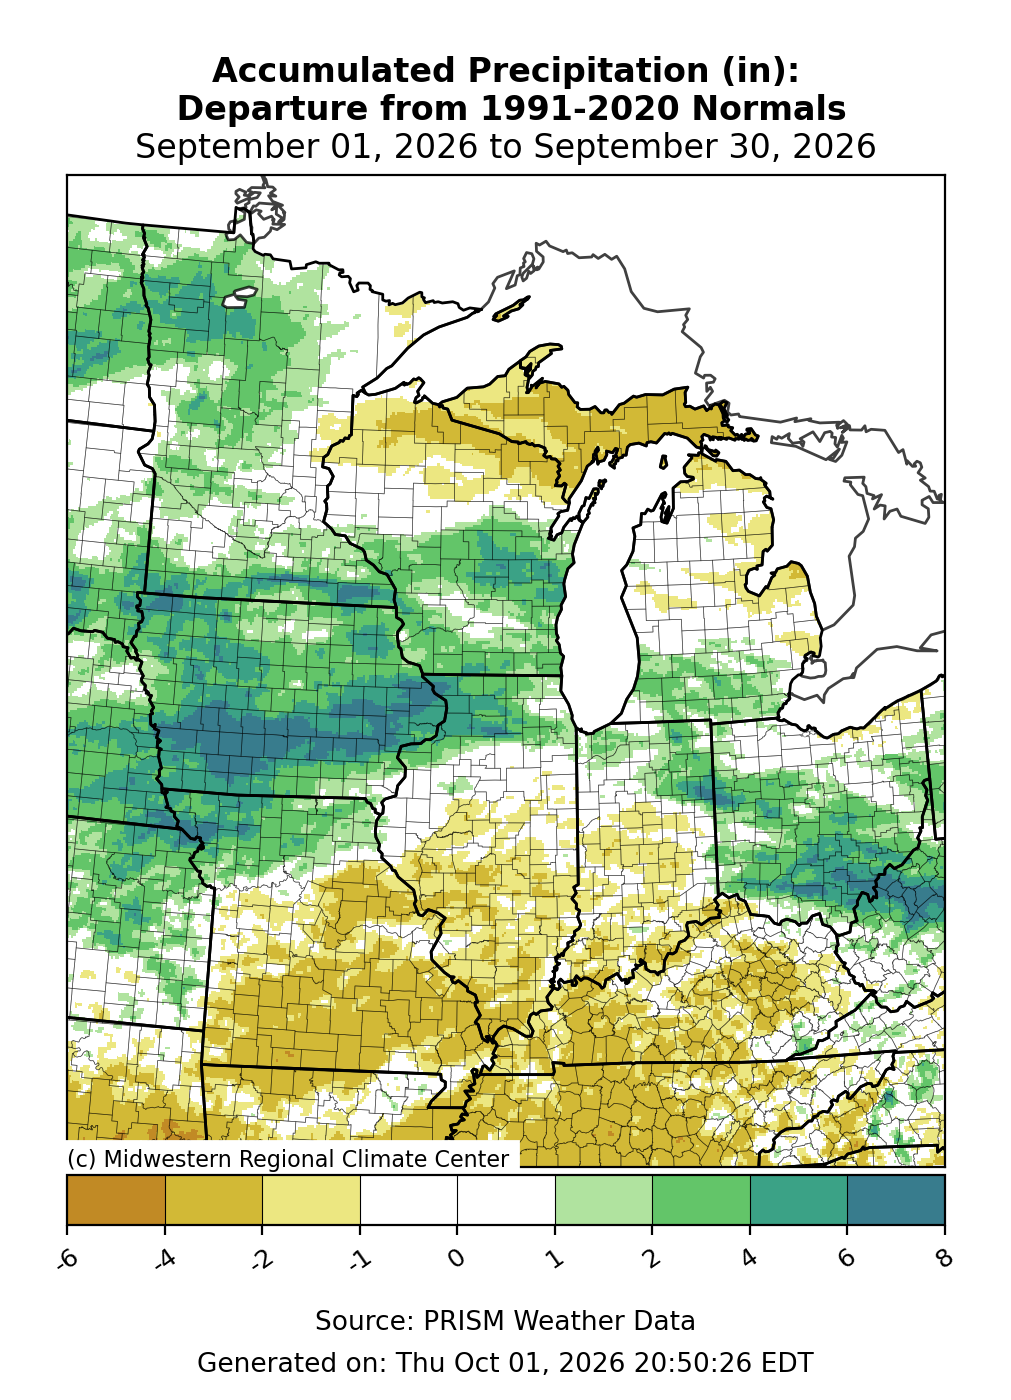
Overall, September 2026 was a wet month with the preliminary average statewide precipitation 4.95 inches, or 1.69 inches above normal. While the rain was welcome over many places, there was too much rain in southeast Minnesota with flooding on September 18 and 19. The wet conditions cuased some improvement in the US drought monitor for the month. One of the higher monthly precipitation totals found so far from the National Weather Service was 9.10 inches at Preston. A Waseca Soil and Water Conservation District observer in New Richland in Waseca County saw 12.93 inches for the month, with 7.51 inches falling on the 18th-19th. One of the drier locations was Sandstone in Pine County with 2.20 inches of precipitation for the month, or 1.27 inches below normal. Gunflint Lake had 2.00 inches of precipitation or 1.51 inches below normal.
[see: September 2026 Precipitation Total Map | September 2026 Precipitation Departure Map | September 2026 Climate Summary Table | 2026 September Departure from Normal Precipitation MapThe largest precipitation event in September 2025 was on September 18-19 when heavy rains caused flooding in southeast Minnesota. The hardest-hit areas included far southern Waseca and Steele counties, and much of Mower, Fillmore, and Houston counties. Rainfall totals in these areas were generally five inches or more, with pocket of 6-8 inches, and even slightly more. An observer near Houston recorded 8.29 inches and one at Spring Valley recorded 8.17. Both of these reports exceed the 100-year return period for 24-hour rains. The deluge resulted in widespread flooding, which triggered mudslides and forced some roads to close. The town of New Richland in southern Waseca County was hit very hard, evacuations and dozens of residents displaced by structural damage from the inundation.
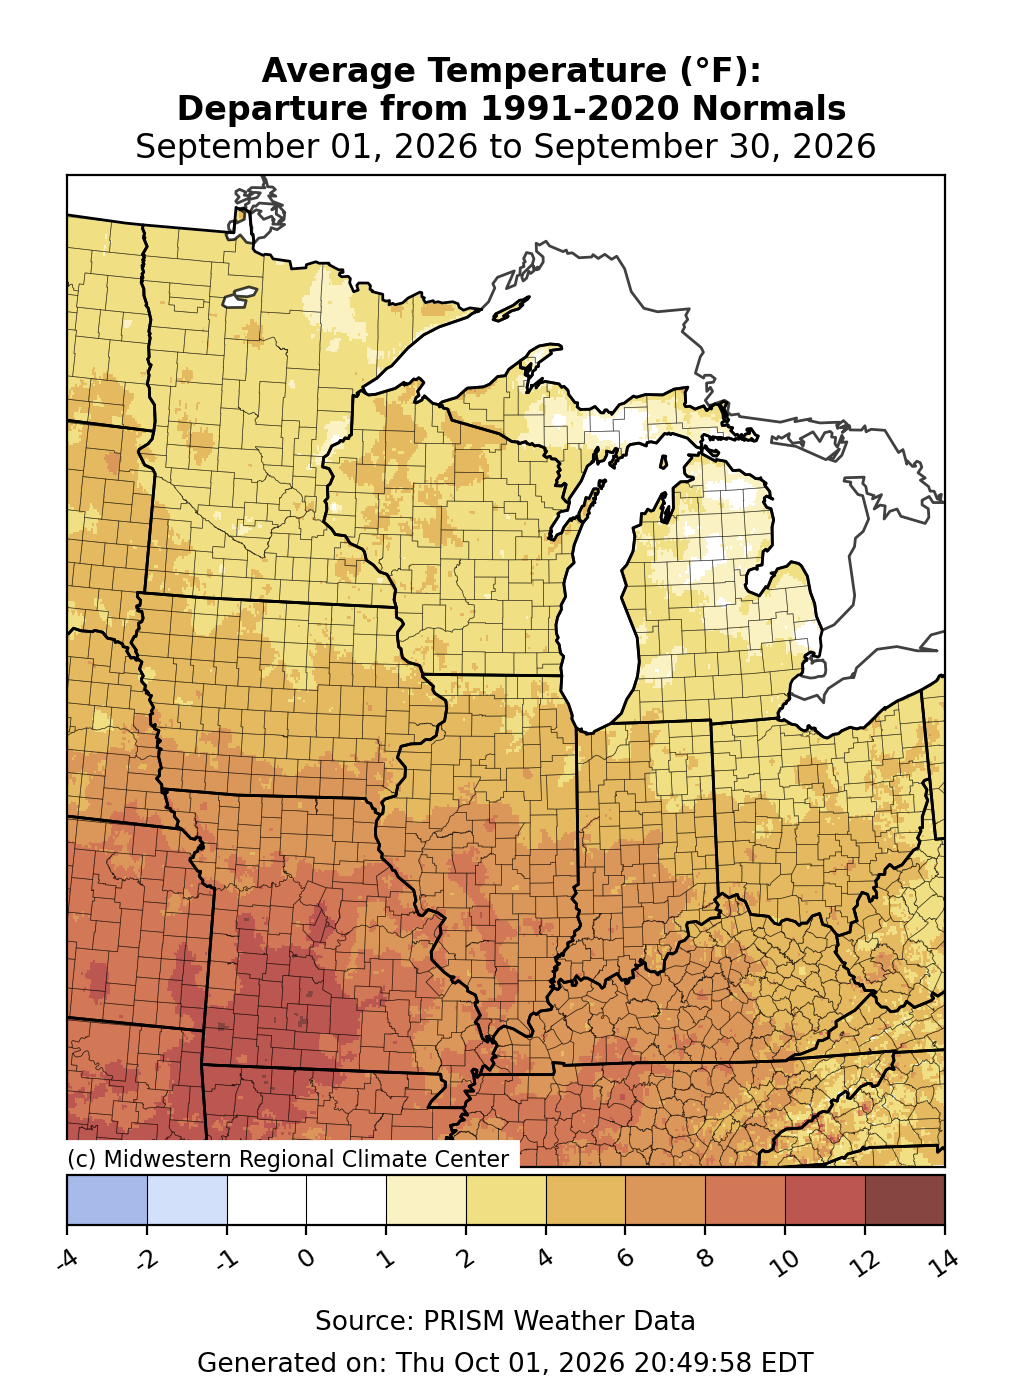
[see: Extreme Rain and Flood, September 18-19, 2026]For the sixth year in a row, the average statewide September temperatures were above normal. The Preliminary average temperature for September 2026 was 62.9 degrees or 3.4 degrees above normal. This is the third year in a row where the September average temperature was three degrees above normal or more. The last time Minnesota had a cool September was in 2020. The warmest temperature reported in September so far in Minnesota was 94 degrees at Hastings Dam on September 1. The coolest temperature reported so far was Celina in St. Louis County with 25 degrees on September 22. While there was scattered frost in the north, no widespread killing frost was reported in central and southern Minnesota during the month of September.
[see: September 2026 Climate Summary Table | 2026 September Departure from Normal Temperature Map]


Where we stand now:
Looking at precipitation for the growing season, there’s a wide range from areas in the southeast ranking in the 90th percentile to east central parts of the state in the bottom 15%. There has been some improvement in the moisture situation over the past month, especially in the northwest part of the state.
[see: Seasonal Precipitation Ranking Maps]The U.S. Drought Monitor map released on October 8 shows that a stubborn drought persists over a good chunk of the state except in the southeast and northwest. 17% of the state is Abnormally Dry, 36% of the state is in the Moderate Drought category, 25% is in the Severe Drought category and 2.5% of the state is in the Extreme Drought category. The U.S. Drought Monitor index is a blend of science and subjectivity where drought categories (Moderate, Severe etc.) are based on several indicators.
[see: Drought Conditions Overview]The U.S. Geological Survey reports that stream discharge varies widely across the state. Streamflows are generally normal to high flows in the south, and northeast and generally below normal to low flow in the east central, west central and the northeast. The Mississippi River at Brooklyn Park was below normal but has a general trend upward over the past month.
[see: USGS Stream Flow Conditions | Weekly Stream Flow Maps and Tables]Water levels fell on lakes in general during the late summer and into autumn. Mille Lacs lake level was 10.22 feet for early October, nearly three tenths of a foot lower than this time last year. On October 8, Minnetonka was at 928.29 ft, about four tenths of a foot lower than this time last year. White Bear Lake was at 922.04 feet, or a little over a foot lower than this time last year. Lake of the Woods was at the low end of the normal band for early October, and Rainy Lake was in the middle of the normal band. Lake Superior was at 601.80 feet on October 7, very close to the October Average of 601.84.
[see: Mille Lacs Lake Water Level | Lake Minnetonka Water Level | White Bear Lake Water Level | Lake of the Woods Control Board Basin Data | Corps of Engineers Great Lakes Water Levels]According to the Agricultural Statistics Service's report on October 5, topsoil moisture across Minnesota was 4 percent Very Short 16 percent Short, 63 percent Adequate, and 17 percent Surplus. On October 4, an estimated 89% of the corn crop was mature, four percent ahead of the five-year average. About 12% was harvested for grain. 7% ahead of the five-year average. 25% of soybeans were harvested, well behind the 51% five-year average. Soil moisture at Lamberton on October 1 was about an inch lower than historical averages.
[see: Agricultural Statistics Service Crop Progress and Condition | U. of M. Southwest Research & Outreach Center (Lamberton)]DNR Forestry rated the potential for wildfires as of October 8 as Moderate over all but parts of central, east central, north central and northeast Minnesota where the fire danger is Low Historically, 80 percent of all wildfires in Minnesota occur during April and May.
[see: Fire Danger Rating Map]
Future prospects:
Warm Octobers tend to follow warm Septembers and the Climate Prediction Center's outlook indicates a generally warm October. The last time there was a below normal statewide average temperature for October was in 2020. Normal October high temperatures are in the 50s and 60s F to start the month, dropping to the low 50s to upper 40s by month's end. Normal lows are in the upper 30s and 40s F early in the month, falling to the upper 20s to 30s by late October.
[see: Climate Prediction Center 30-day Outlook | October Temperature Normal Map]
The Climate Prediction Center outlook for October leans dry across the state. Normal October precipitation is greatest in the northeast, averaging around 3.5 inches in Cook County. Values drop in all directions, to around 1.5 inches in northwest Minnesota, to around 1.75 inches in the southwest, and to 2.5 inches in east-central Minnesota.
[see: Climate Prediction Center 30-day Outlook | October Precipitation Normal Map]According to the most recent El Niño-Southern Oscillation (ENSO) Outlook, there is a 100% chance of a very strong El Niño developing during the winter of 2026-27. The Climate Prediction Center’s Outlook for December 2026-February 2027 has a strong tendency for above normal temperatures.
[see: Climate Prediction Center December-February Outlook]The National Weather Service produces long-range probabilistic river stage and discharge outlooks for the Red River, Minnesota River, and Mississippi River basins. These products address both high flow and low flow probabilities.
[see: National Weather Service - North Central River Forecast Center]
From the author:
Ever since the 2020s began, drought has recurred repeatedly in Minnesota, broken by well-timed and sometimes significant wet spells. During 2026, the drought intensified in the summer across many areas in the state. Through October 7, the Twin Cities was at 20.23 inches of precipitation for the year so far. 6.74 inches below the 1991-2020 normal. Statewide precipitation from January through early October is about 2.5 inches below normal. Only once in the 2020s has the statewide average precipitation finished above normal and that was in 2024.
Upcoming dates of note:
October 15: National Weather Service releases 30/90 day temperature and precipitation outlooks
 Subscribe to email announcements of the monthly posting of this product.
Pete Boulay, DNR Climatologist