HydroClim Minnesota for Early September 2021
A monthly electronic newsletter summarizing Minnesota's climate conditions and the resulting impact on water resources. Distributed on the first Thursday of the month.
State Climatology Office - DNR Division of Ecological and Water Resources, St. Paul
distributed: September 8, 2021
What happened in August 2021:
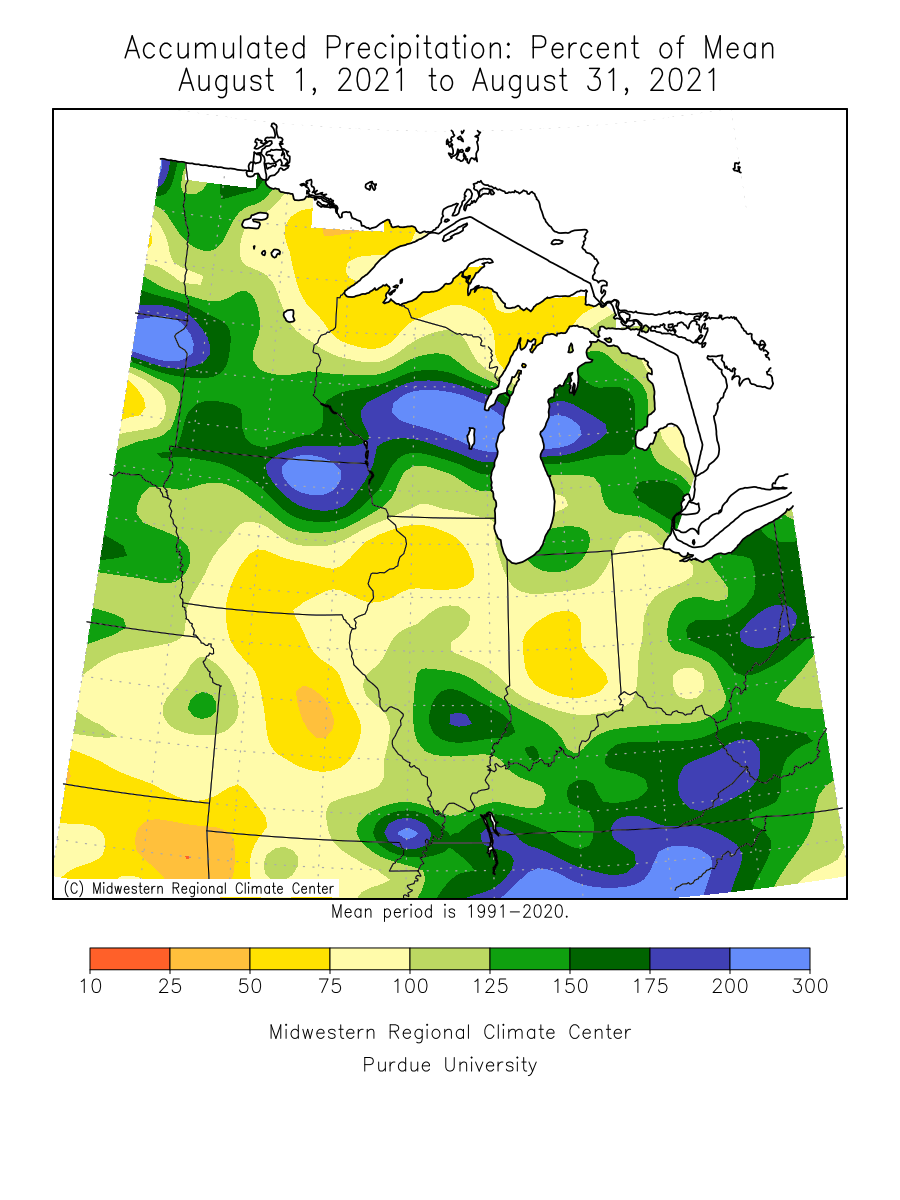
- August 2021 brought some welcome relief to the drought across the central and southern parts of the state. Precipitation totals were from one to three inches above normal over many places in the south. Northwest Minnesota also saw a surplus of precipitation. Northeast Minnesota in general fell short of normal. The National Weather Service cooperative observer at La Crescent (far southeastern Minnesota) recorded the highest monthly rainfall total, with 11.85 inches. Other high totals included 11.15 inches at Grand Meadow, 11 inches in Winona, 9.34 inches at Hokah (which had led the state with over six inches of rain during July), and 8.92 inches at Caledonia. One of the lower totals was the Duluth International Airport with 2.44 inches or 1.29 inches short of normal. In general, the average station in the state had around five inches of precipitation.
[see: August 2021 Precipitation Total Map | August 2021 Precipitation Departure Map | August 2021 Climate Summary Table | August 2021 Percent of Normal Precipitation Map] - The notable rain and storm events in August 2021 happened in the last week of the month. Wave after wave of thunderstorms provided widespread soaking rains in southern Minnesota on August 26-27, as well as the state's highest 24-hour rainfall totals recorded to date in 2021.
[see: Heavy Rain, August 26-27, 2021] - Thunderstorms pounded many parts of Minnesota throughout the day on Saturday, August 28, with scattered reports of wind damage, large hail, and flash-flooding, along with a widespread soaking rainfall elsewhere in state.
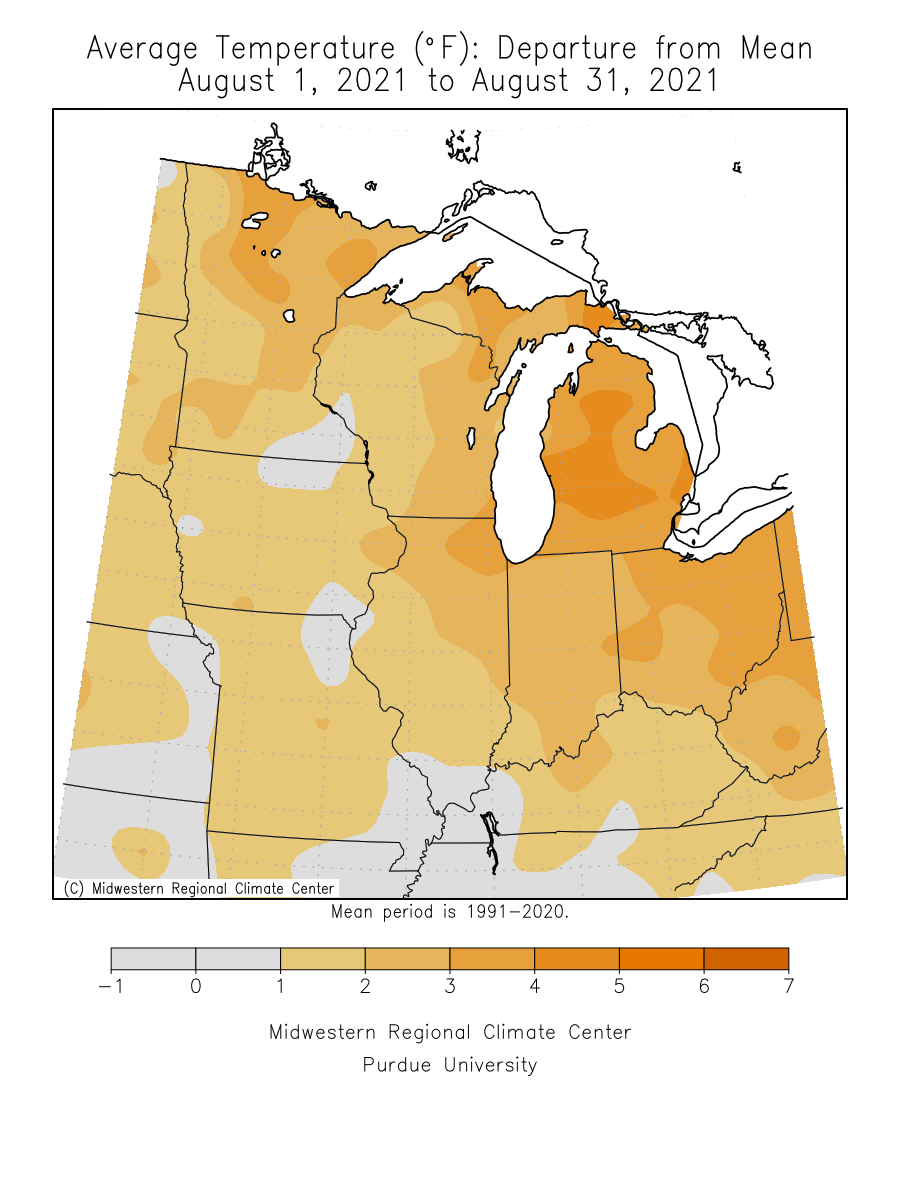
[see: Severe Thunderstorms with Heavy Rain, August 28, 2021] - Like July 2021, August was warm without being exceptionally hot, though there was a twist. On one hand, no station in the state recorded a 100-degree F or higher temperature during the month. On the other hand, the state experienced an unusual geographic reversal in patterns of hot days, such that northern Minnesota had more 90-degree days than southern Minnesota. All of the stations with at least eight high temperatures of 90 F or higher for the month were in the northern half of the state, led by Sebeka (Wadena County), which reported ten. By contrast, the Twin Cities station only recorded four 90-degree days, and Rochester reported none. The preliminary average temperature for the state for August 2021 was 70.1 degrees or 2.3 degrees above normal.
[see: August 2021 Climate Summary Table | 2021 August Departure from Normal Temperature Map]
Where we stand now:
- Seasonal precipitation totals (April 1 through September 7) ranked above the historical median over the southeast and small areas of the west central, south central and southwest, while the majority of the state is areas below the historical median. A large portion of northern Minnesota, with the exception of the northwest is below the 20th percentile and a sizable areas is below the 5th percentile.
[see: Seasonal Precipitation Ranking Map] - The U. S. Drought Monitor map released on September 2 depicts 8% of the state in the Abnormally Dry category, 23% in the Moderate Drought category, 27% in the Severe Drought category, 31% in the Extreme Drought category and 7% in the Exceptional Drought category. Beginning with the August 10 Drought Monitor, this was the first time since the inception of the U.S. Drought Monitor in 2000 that the Exceptional Drought intensity was reported. The U.S. Drought Monitor index is a blend of science and subjectivity where drought categories (Moderate, Severe, etc.) are based on several indicators.
[see: Drought Conditions Overview] - The U.S. Geological Survey reports that stream discharge levels to be below normal to much below normal across the central and north, with generally normal to above normal stream flows in the south. A few locations in far southern Minnesota and in Lac Qui Parle County have much above normal stream flows. Some locations in north central and northeast have low flow conditions, levels that are in the 1 percentile.
[see: USGS Stream Flow Conditions] - Water levels on Minnesota lakes vary depending on lake and location in the state. Mille Lacs was at 10.57 feet, about half a foot below the 27 year median for early September. On September 7, Minnetonka was at 928.40 feet, .57 feet lower than this time last year. Gray's Bay Dam closed on July 21. On September 8, White Bear Lake was at 923.77 feet, .83 feet lower than last year. Rainy Lake was well below the normal band for lake level. Lake of the Woods was well below the median level for early August and was near the 10th percentile. Lake Superior was forecasted to be at 602.10 feet on September 3, one inch below the early September average and 12 inches below the September level set in 2020. The lake level in Superior is forecast for a continued slow fall over the next month.
[see: Mille Lacs Lake Water Level | Lake Minnetonka Water Level | White Bear Lake Water Level | Lake of the Woods Control Board Basin Data | Corps of Engineers Great Lakes Water Levels] - The Agricultural Statistics Service on September 5 reports that topsoil moisture across Minnesota is 15 percent Very Short, 26 percent Short, 54 percent Adequate, and 5 percent Surplus. This is a substantial improvement since early August. Available soil water at Lamberton on September 1 was approximately 3.7 inches, and improvement of over two inches since the middle of August, and only about a half inch short of the median.
[see: Agricultural Statistics Service Crop Progress and Condition | U. of M. Southwest Research & Outreach Center (Lamberton)] - The potential for wildfires rated by DNR Forestry on September 8, as Low across eastern and north central Minnesota. Moderate potential exists over southwest and central Minnesota, with High potential over the west central and the northwest. Historically, 80 percent of all wildfires in Minnesota occur during April and May. Rain and cooler weather during the last week of August and the first week of September aided the wildfire battle in northeast Minnesota.
[see: Fire Danger Rating Map]
Future prospects:
- The September precipitation outlook has equal chances for below, normal and above normal precipitation. September precipitation normal values range from about one-and-a-half inches in northwest Minnesota to about four inches in northeast and southeastern counties.
[see: Climate Prediction Center 30-day Outlook | September Precipitation Normal Map] - The September temperature outlook also has equal chances for below, normal and above normal temperatures. Normal September high temperatures are in the middle to upper 70's degrees to start the month, dropping to the low to mid 60's by month's end. Normal lows are in the 50's early in the month, falling to the middle 30's to mid-40s by late September.
[see: Climate Prediction Center 30-day Outlook | September Temperature Normal Map] - The 90-day precipitation outlook for September through November indicates an equal chance for above, below and normal precipitation in eastern Minnesota, with a tilt to below normal precipitation in the west. The September through November temperature projection offers a tendency for above-normal conditions statewide.
[see: Climate Prediction Center 90-day Outlook] - The Winter Outlook (December-February) from the Climate Prediction Center depicts equal chances for below-normal, near-normal, or above-normal temperature and precipitation statewide. The last two winters (December-February) have been above normal for temperature in Minnesota with the winter of 2018-2019 the last time average temperatures were below normal.
[see: Climate Prediction Center 3.5 month Outlook] - The National Weather Service produces long-range probabilistic river stage and discharge outlooks for the Red River, Minnesota River, and Mississippi River basins. These products address both high flow and low flow probabilities.
[see: National Weather Service - North Central River Forecast Center]
From the author:
- The Drought of 2021 (which actually began in 2020) was the most intense drought since the 1987-89 Drought in Minnesota. While drought conditions have eased in parts of the state, the drought continues and its effects will likely linger into 2022.
[see: The Drought of 2021]
Upcoming dates of note:
- September 16: National Weather Service releases 30/90 day temperature and precipitation outlooks
![]() Subscribe to email announcements of the monthly posting of this product.
Subscribe to email announcements of the monthly posting of this product.
Pete Boulay, DNR Climatologist