

A monthly electronic newsletter summarizing Minnesota's climate conditions and the resulting impact on water resources.
State Climatology Office - DNR Division of Ecological and Water Resources, St. Paul
distributed: September 11, 2026
What happened in August 2026:
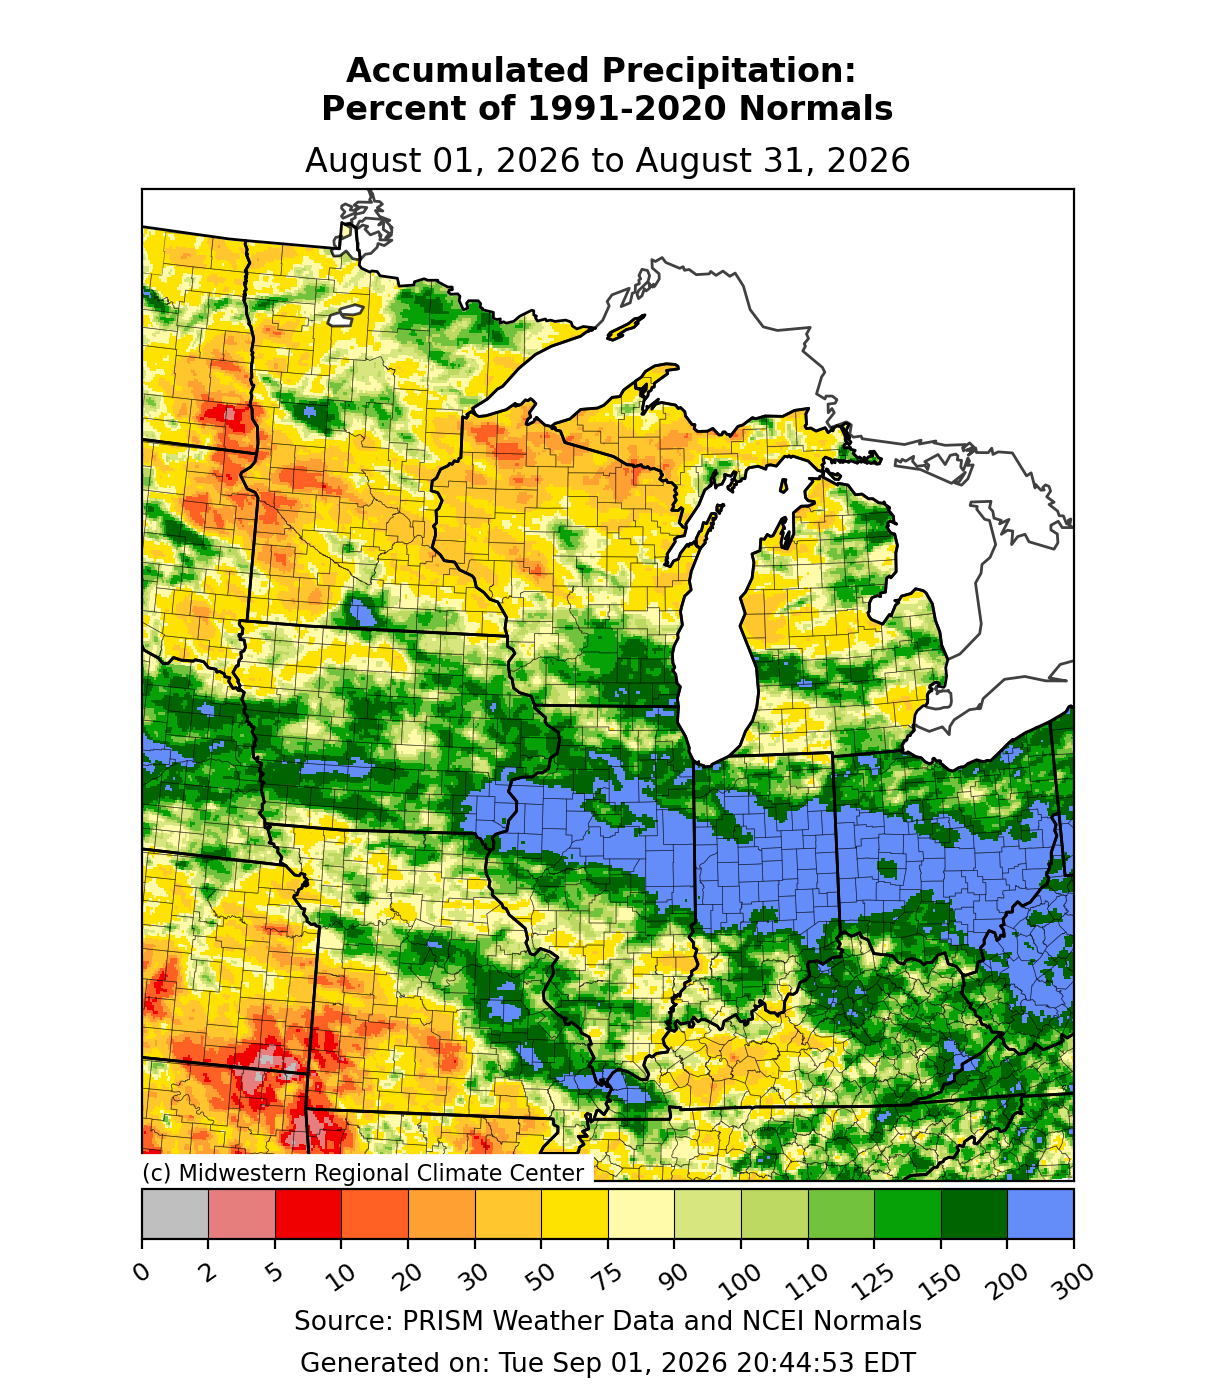
Most places in Minnesota finished with below normal precipitation for August 2026, but there were a few big exceptions. One of the largest totals was at Blue Earth in Faribault County with 10.19 inches of rain for the month, or 6.32 inches above normal. One of the driest locations was Morris in Stevens County that saw .33 inches or 3.13 inches below normal. The preliminary statewide average precipitation was 2.34 inches or 1.38 inches below normal.
[see: August 2026 Precipitation Total Map | August 2026 Precipitation Departure Map | August 2026 Climate Summary Table | August 2026 Percent of Normal Precipitation Map]There were no tornadoes reported in Minnesota for August 2026. This was the first time Minnesota was tornado-free in August since 2011. Not to say there wasn’t any severe weather during the month. Thunderstorms with large hail were reported on multiple days of the month, especially in the north half of the state. Large hail was reported over parts of the state on August 6-7, August 17, and August 20. Crops were damaged in the vicinity of Averill in Clay County and hail the size of tennis balls were observed northwest of New York Mills on August 17th.
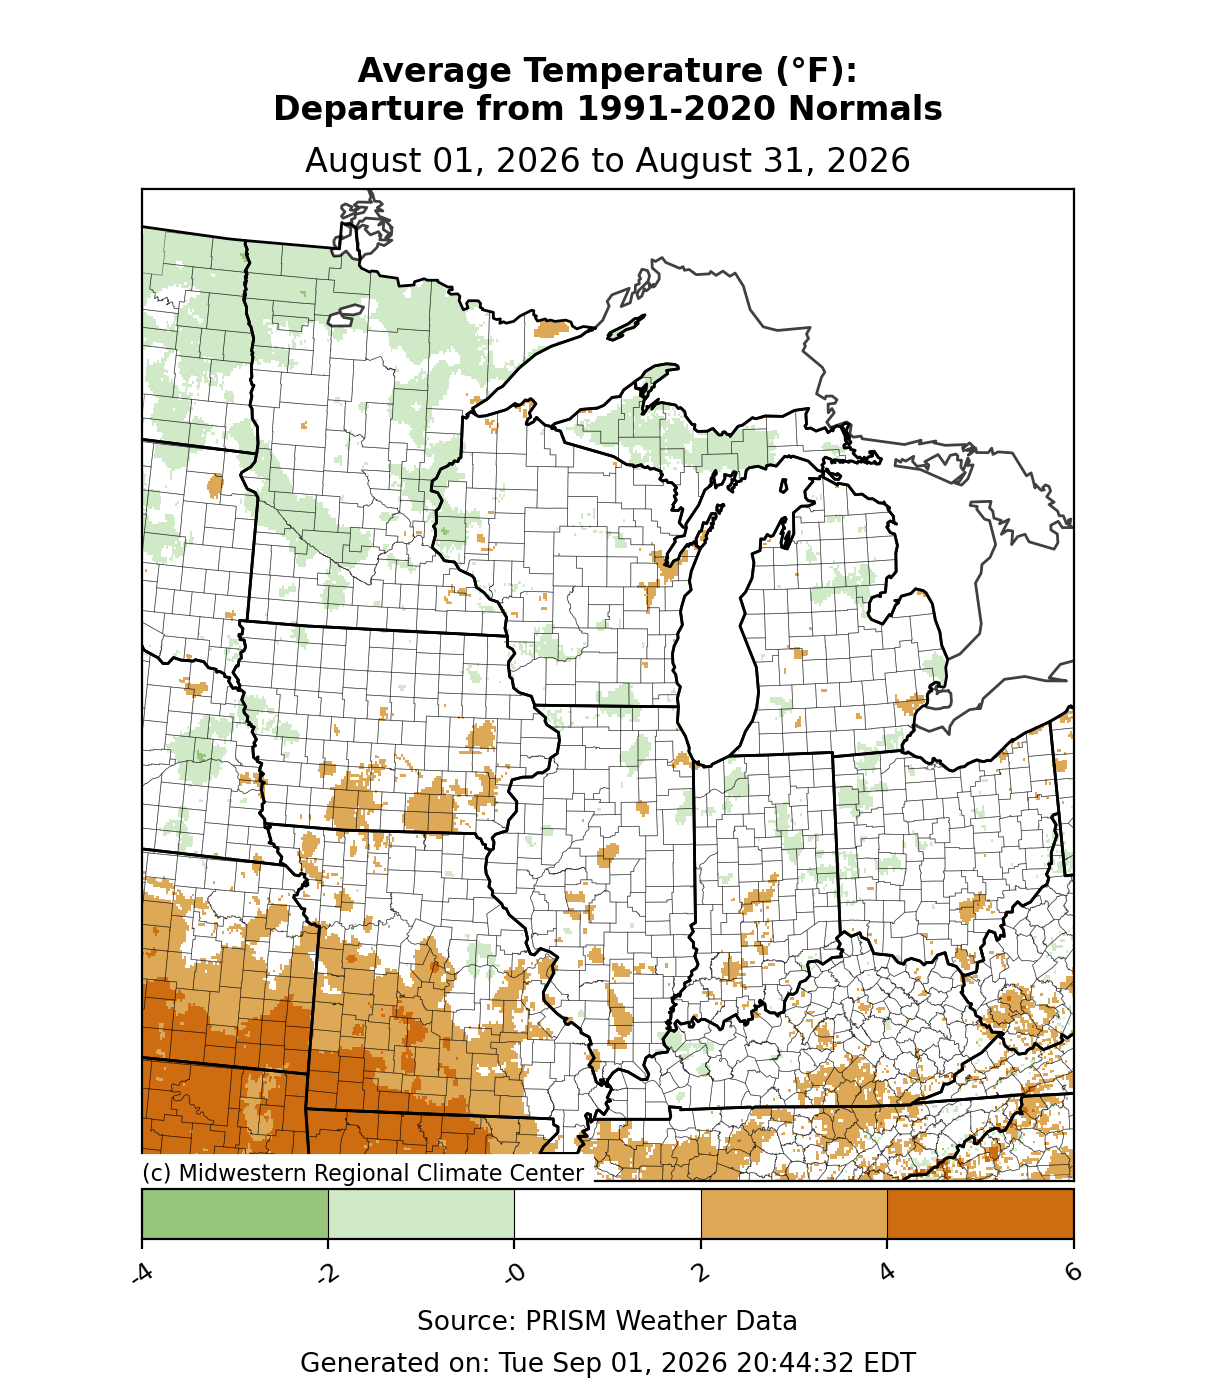
[see: Preliminary Severe Storm Report for August 17 from the Storm Prediction Center. ]August 2026 was above normal for statewide average temperature, the seventh August in a row where Minnesota finished with above normal temperatures. The preliminary average was 68 degrees or .6 degrees above normal. The highest air temperature found so far was 95 degrees at Pipestone on August 31. The coldest temperature found so far was 31 degrees at Wolf Ridge on August 28. The Minnesota State Fair weather-wise wasn’t as pleasant as 2025. For every day of the fair, the high temperature was 80 degrees or warmer and three of those days were 90 degrees or above.
[see: Minnesota State Fair Weather][see: August 2026 Climate Summary Table | 2026 August Departure from Normal Temperature Map]


Where we stand now:
Seasonal precipitation totals (April 1 through September 8) generally ranked below normal over most of central and northern Minnesota, with some pockets of precipitation in the 10th percentile or less. There are also areas of the state with well above normal precipitation including south central, southeast and parts of northwest Minnesota.
[see: Seasonal Precipitation Ranking Map]The U. S. Drought Monitor map released on September 8 depicts quite a bit more drought coverage compared to a year ago. 23% of the state is in the Abnormally Dry category, 25% of the state is in the Moderate Drought category, 42% of the state is in the Severe Drought category, and 4.3% of the state is in the Extreme Drought category. The U.S. Drought Monitor index is a blend of science and subjectivity where drought categories (Moderate, Severe, etc.) are based on several indicators.
[see: Drought Conditions Overview]The U.S. Geological Survey reports mostly normal stream flows (the 25th to the 75th percentile) in southern and western Minnesota, and below to much below normal stream flows in east central, north central and the northeast. [see: Cooperative Stream Gauging | USGS Stream Flow Conditions]
Water levels on Minnesota lakes vary depending on lake and location in the state. Mille Lacs on September 11 was at 10.42 feet, about three tenths of a foot lower than this time last year. On September 10, Minnetonka was at 928.41 feet, eight tenths of a foot lower than this time last year. Gray’s Bay Dam was closed on August 24. On September 11, White Bear Lake was at 922.22 feet, about a foot lower than this time last year. The level of Lake of the Woods is just below the median band, with a fairly stable trend. Rainy Lake is right in the middle of the median band. Lake Superior was measured at 602.07 feet on September 10, about a tenth of a foot higher than this time last year. The long-term average is 602.17 feet.
[see: Mille Lacs Lake Water Level | Lake Minnetonka Water Level | White Bear Lake Water Level | Lake of the Woods Control Board Basin Data | Great Lakes Water LevelsThe Agricultural Statistics Service on September 8 reports that topsoil moisture across Minnesota is 17 percent Very Short, 37 percent Short, 43 percent Adequate, and 1 percent Surplus. Available soil water at Lamberton on August 15 was approximately 3.83 inches, .37 inches below normal.
[see: Agricultural Statistics Service Crop Progress and Condition | U. of M. Southwest Research & Outreach Center (Lamberton)]The potential for wildfires rated by DNR Forestry on September 11, as Low across parts of the southeast and north central, and Moderate over the rest of the state. Historically, 80 percent of all wildfires in Minnesota occur during April and May.
[see: Fire Danger Rating Map]
Future prospects:
The September precipitation outlook has equal chances for below, normal and above normal precipitation. Recent Septembers have been dry. The last time there was a September with much above normal precipitation was in 2019. September precipitation normal values range from about one-and-a-half inches in northwest Minnesota to about four inches in northeast and southeastern counties.
[see: Climate Prediction Center 30-day Outlook | September Precipitation Normal Map]There has only been one September in the past eleven years that had an average statewide temperature below normal. So far for the first ten days of the month the air temperature has been much above normal and the statewide temperature average for September 1-10 in the state is 7.6 degrees above normal. Indeed, the September temperature outlook has a fairly strong tendency for above normal temperatures. Normal September high temperatures are in the middle to upper 70s to start the month, dropping to the low to mid 60s by month's end. Normal lows are in the 50s early in the month, falling to the middle 30s to mid-40s by late September.
[see: Climate Prediction Center 30-day Outlook | September Temperature Normal Map]The 90-day precipitation outlook for September through November indicates an equal chance for above, below and normal precipitation across the state. The September through November temperature projection offers a tendency for above-normal conditions statewide. [see: Climate Prediction Center 90-day Outlook]
The Winter Outlook (December-February) from the Climate Prediction Center depicts a fairly strong tendency for above normal temperatures and precipitation over the entire state, especially in the north. There are equal chances for below, above and normal precipitation. A strong El Niño is expected to be present this winter.
[see: Climate Prediction Center 3.5 month Outlook]The National Weather Service produces long-range probabilistic river stage and discharge outlooks for the Red River, Minnesota River, and Mississippi River basins. These products address both high flow and low flow probabilities.
[see: National Weather Service - North Central River Forecast Center]
From Kenny Blumenfeld:
As 2026 has worn on, Minnesotans have begun hearing a lot about a possible "Super" El Niño developing this fall and winter. What is El Niño and why would a "super" one matter? This article is intended to help readers understand this important global climate pattern, and what it has meant for Minnesota historically. This story updates the version shared before the 2023-24 El Niño. [see: "El Niño" is Coming. What Might That Mean for Minnesota's Weather?]
Upcoming dates of note:
September 17: National Weather Service releases 30/90 day temperature and precipitation outlooks
 Subscribe to email announcements of the monthly posting of this product.