A monthly electronic newsletter summarizing Minnesota's climate conditions and the resulting impact on water resources. Distributed on the first Thursday of the month.State Climatology Office - DNR Division of Ecological and Water Resources, St. Paul
distributed: February 10, 2023
 Subscribe to email announcements of the monthly posting of this product.
distributed: February 10, 2023
What happened in January 2023:
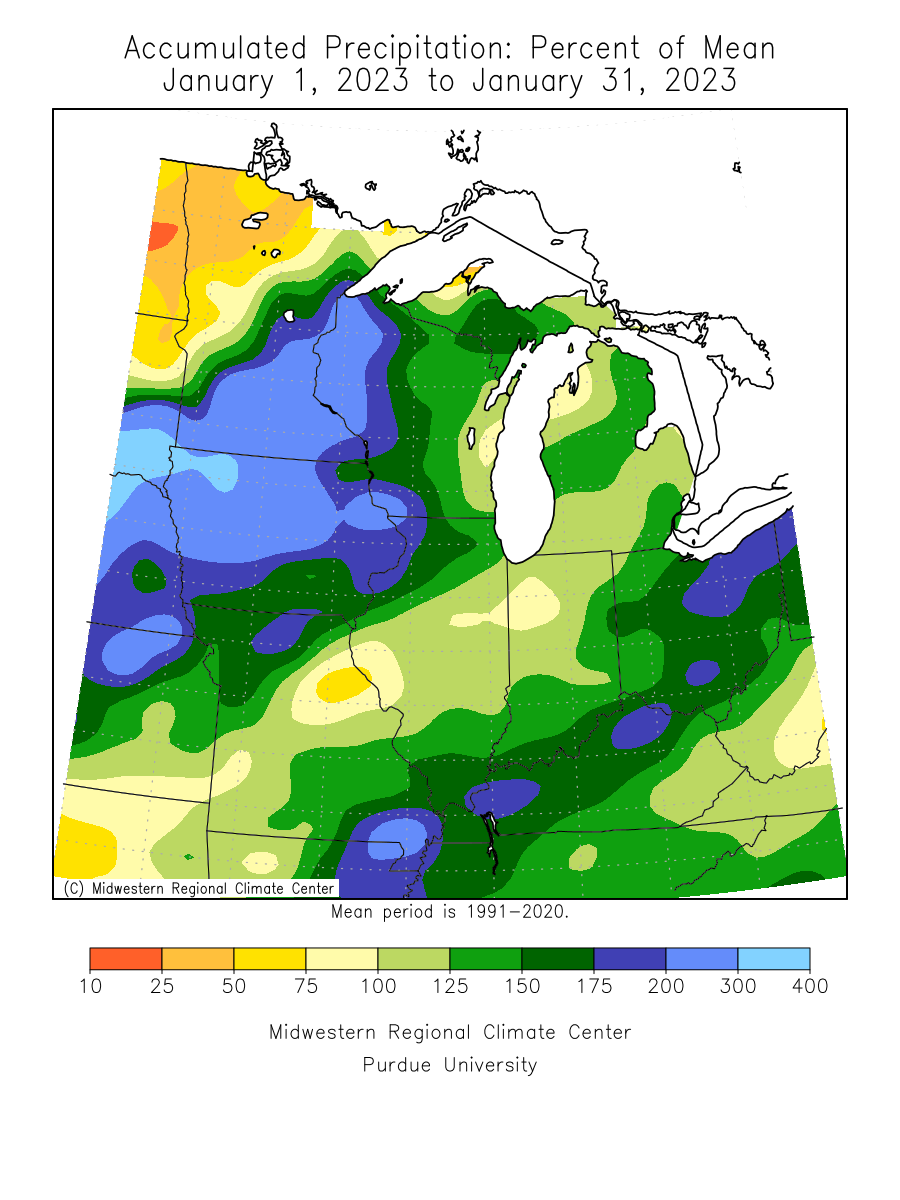
- The storm track in January, 2023 favored the south half of Minnesota for the most part, with higher precipitation generally south of a line from Breckenridge to Duluth. Much of south central to east central Minnesota was one to two inches above normal. The wettest location found so far was Owatonna in south central Minnesota with 2.54 inches or 1.67 inches above normal. Northwest Minnesota was quite dry, generally about a half inch below normal. One of the drier locations was at Crookston with only .18 inches or .33 inches below normal. The preliminary statewide precipitation average for January 2023 was 1.38 inches or 0.60 inches above normal.
[see: January 2023 Precipitation Map | January 2023 Precipitation Departure Map | January 2023 Climate Summary Table | January 2023 Percent of Normal Precipitation Map] - There largest precipitation event was right at the start of the month. The New Year greeted Minnesota with another large, messy winter storm, as a concoction of heavy snow, freezing rain, sleet, rain, and thunderstorms pounded parts of the state from Monday January 2nd through Thursday January 5th, 2023. The storm produced widespread accumulations of over one foot, and broke into the top-20 for storm-total snowfall in the Twin Cities with 15.1 inches. Rochester saw 1.12 inches of rain on the 3rd.
[see: Another Big, Messy Winter Storm] - Another snowstorm favored the far southern counties of the state on January 18-19. Hills in Rock County in southwest Minnesota saw 5.8 inches. The snow was a bit heavier over southeast Minnesota with 7.3 inches at Rochester.
[see: Southwest Minnesota Snowstorm Summary from the Sioux Falls National Weather Service. ] - [see: January 18-19 Snowstorm Summary from the La Crosse National Weather Service. ]
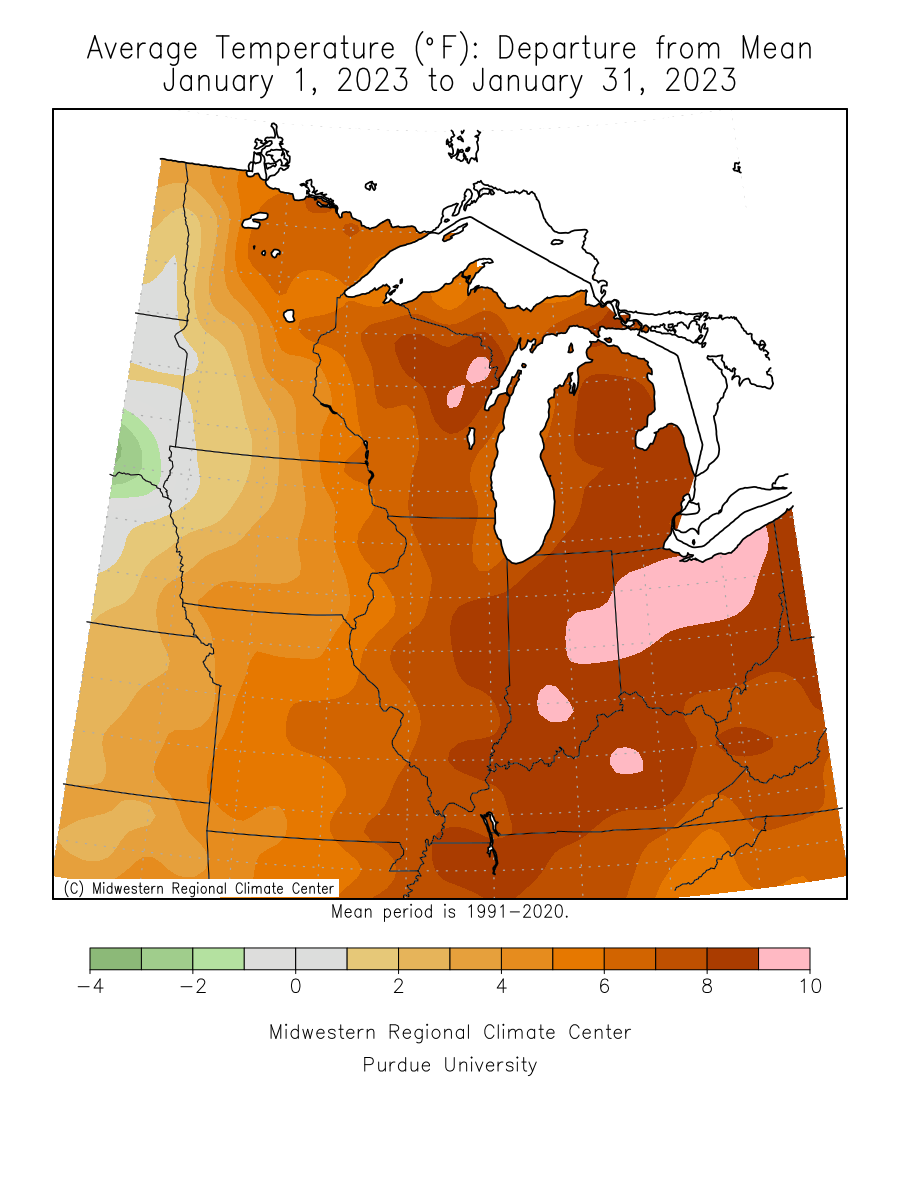
- It had looked like January might finish in the top ten warmest Januaries on record, but then the last four days of the month proved to be a spoiler. The first three weeks of the month was mild, but gloomy compared to past Januaries. In fact January 1-25 was the gloomiest first twenty five days of January on record for the University of Minnesota St. Paul Campus climate observatory. The preliminary statewide average temperature for January 2023 was 4.8 degrees above normal. The warmest temperature of January 2023 was 44 degrees at Minnesota City Dam in southeast Minnesota on the 2nd and the coldest temperature of the month was -37 degrees at Celina on January 29 and 30.
[see: January 2023 Climate Summary Table | January 2023 Departure from Normal Temperature Map
Where we stand now:
- As of February 9, despite a little bit of melting, snow depth readings are much deeper than the historical median from southwest to east central Minnesota, and above or near the median across the north. Southeast Minnesota is below the median. The deepest snow is in its typical location, in the highlands of Lake Superior where snow depths are two to nearly three feet in some locations.
[see: Weekly Snow Depth and Ranking Maps | NWS Snow Depth Estimation Map | Midwest Regional Climate Center Snow Depth Map] - The U. S. Drought Monitor map released on February 9, 2023 depicts 60% of the state with some level of drought designation. About 24% of the state was Abnormally Dry, and 31% of the state in Moderate Drought conditions. A swath from Redwood to Jackson and Martin Counties Severe Drought conditions. The U.S. Drought Monitor index is a blend of science and subjectivity where drought categories (Moderate, Severe, etc.) are based on several indicators.
[see: Drought Conditions Overview] - The U.S. Geological Survey reports that stream discharge values (where winter measurements are possible) range from normal to much above normal. Few Minnesota rivers have stream flow data. Most rivers and streams are now impacted by ice.
[see: USGS Stream Flow Conditions] - In their final report for the season, On November 29, 2022 the Agricultural Statistics Service reported that topsoil moisture across Minnesota was 18 percent Very Short, 35 percent Short, 46 percent Adequate, and 1 percent Surplus. Corn for grain harvest was 96% completed by November 14, on pace with 2021 and about two weeks ahead of the five year average. Soil moisture levels at Lamberton on November 1 showed a soil moisture deficit going into freeze-up.
[see: Agricultural Statistics Service Crop Progress and Condition | U. of M. Southwest Research & Outreach Center (Lamberton) | U. of M. Southern Research & Outreach Center (Waseca)] - The potential for wildfires is currently rated by DNR Forestry as Low across Minnesota.
[see: Fire Danger Rating Map] - Soil frost depths under sod are very shallow for early February, ranging from about a foot or less over many southern and eastern locations in the state. Where there is a deep snowpack, there is little if any frost in places like Lamberton and Duluth. At Watson and Morris in west central and northwest Minnesota, frost depth is deeper, approaching two feet. The deepest frost found was 30 inches at Grand Forks. Soil temperatures at the U of M St. Paul Campus Climate Observatory have stayed near 32 degrees at the four inch depth throughout much of the winter.
[see: National Weather Service Frost Depth Data | MnDOT Road Frost Depths | University of Minnesota - St. Paul Campus Soil Temperatures Under Sod] - Like many lake ice-in seasons, the ice formed in fits and starts across the state. In general, lake ice formed near the median at most places. There was a good start to the lake ice season, then the heavy snows came and caused some slushy conditions. Lake Superior ice cover is quite low this season compared to average.
[see: DNR Conservation Officer Reports | 2021 Lake Ice-In Dates | Great Lakes Ice Cover]
Future prospects:
- The February precipitation outlook has a tendency for above normal precipitation in the north and southeast and equal chances for above below and normal precipitation over the central, south central and southwest. Precipitation normals range from near one-half inch of liquid equivalent in western Minnesota to just over three-quarter of an inch of precipitation in eastern sections of the state. The median snow depth at the end of February ranges from under five inches in southwest Minnesota to over 18 inches on the ground in northeastern Minnesota (greater than 30 inches in the Lake Superior highlands).
[see: Climate Prediction Center 30-day Outlook | February Precipitation Normal Map] - The February temperature outlook has equal chances for above, normal and below normal temperatures. December 2022 was below normal, January 2023 was above normal. Normal February high temperatures range from the low teens in the north to near 20 in the south early in the month, climbing to the mid-20s to low 30s by month's end. Normal February low temperatures range from near minus 10 degrees in the far north to the single digits above zero in southern Minnesota early in the month; ascending to the low single digits in the north, mid-teens in the south by the end of February.
[see: Climate Prediction Center 30-day Outlook | February Temperature Normal Map] - The 90-day precipitation outlook for February through April indicates a tendency for above normal precipitation in northern and southeast Minnesota, with equal chances of above, normal and below normal precipitation over the southwest third of the state.
[see: Climate Prediction Center 90-day Outlook] - The National Weather Service produces long-range probabilistic river stage and discharge outlooks for the Red River, Minnesota River, and Mississippi River basins. These products address both high flow and low flow probabilities. Here are the current weather conditions impacting prospects for spring snow melt flooding:
- Red River: As of February 10, conditions have remained very dry since the end of January. Key message: The risk for significant (moderate or higher) spring flooding remains low, running slightly below long-term historical averages across the Red River Basin.
- Minnesota and Mississippi: Overall, the initial flood threat is close to normal or average. While we have a pretty hefty snowpack over the entire area, factors such as drier than normal soils, low water levels in rivers/lakes/wetlands/, and a shallow frost depth should help alleviate the overall threat. As is often the case with the early February outlook, much is still to be determined by temperatures and rainfall in the spring.
- We still have quite a bit of winter to go, so there may be changes to the situation.
From the author:
- None
Upcoming dates of note:
- February 16: National Weather Service releases 30/90 day temperature and precipitation outlooks