State Climatology Office - DNR Division of Ecological and Water Resources, St. Paul
distributed: April 10, 2020
What happened in March 2020:
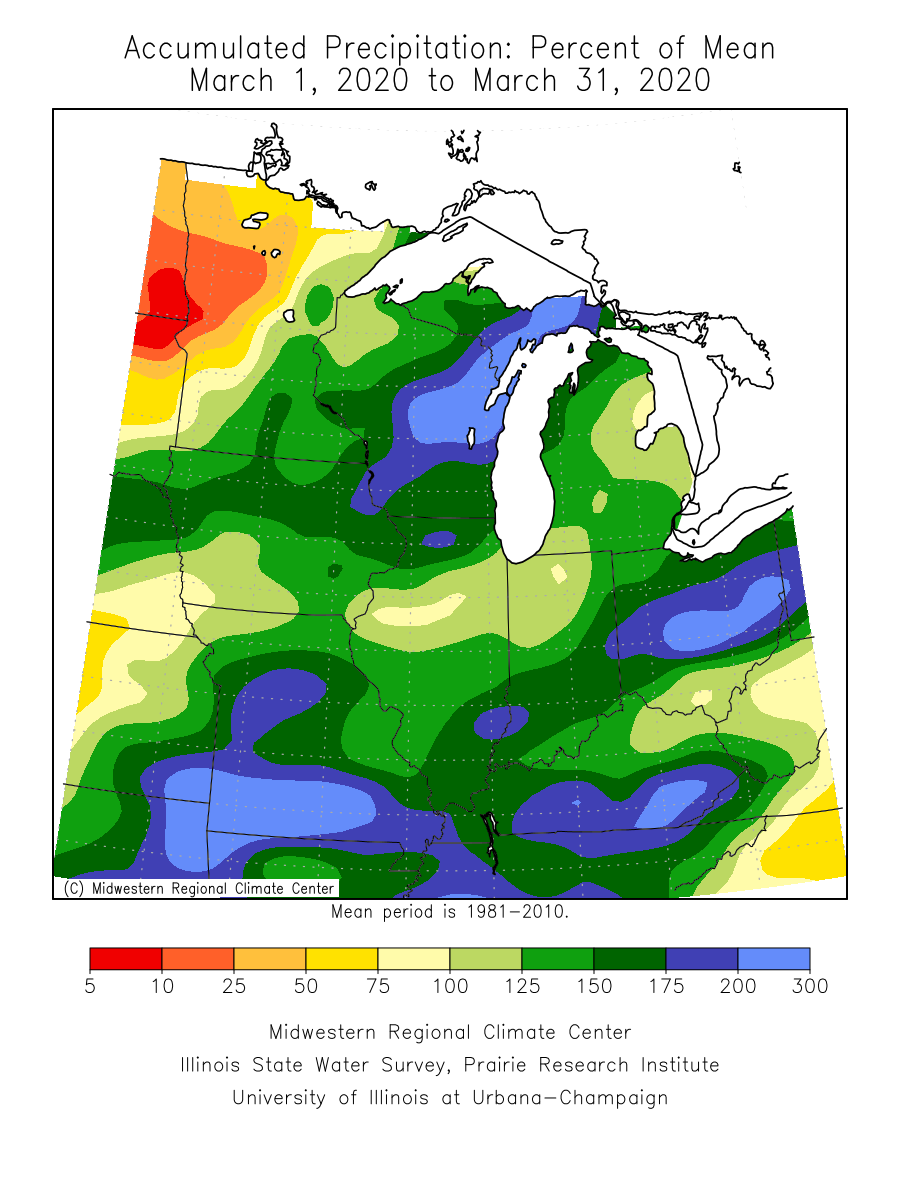
- March monthly precipitation totals were generally above normal across the southeast, east central and northeast and below normal in the northwest. The wettest areas were in southeastern Minnesota where a surplus of a half to one-and-a-half inches was common. Most of the precipitation came in the second half of the month. Wells in Faribault County reported 3.39 inches or 1.84 inches above normal. West central Minnesota fell short of normal by about an inch to an inch-and-a-half. One of the drier locations was Ada in northwest Minnesota with only .08 inches of precipitation or .92 inches below normal.
[see: March 2020 Precipitation Total Map | March 2020 Precipitation Departure Map | March 2020 Climate Summary Table | March 2020 Percent of Normal Precipitation Map] - After a relatively tranquil first half of the month, the second half had a more active pattern that carried over into early April. A strong spring storm brought thunderstorms and heavy rain to southern Minnesota on March 28-29, with accumulating snows to central and northeastern Minnesota, and strong winds to the entire region.
[see: Spring Storm of March 28-29 2020] - April fooled much of Minnesota with a strong cold front that dropped temperatures from the 50s and 60s into the teens and 20s. The air mass transition produced heavy wintry precipitation in northwestern parts of the state, with light precipitation elsewhere.
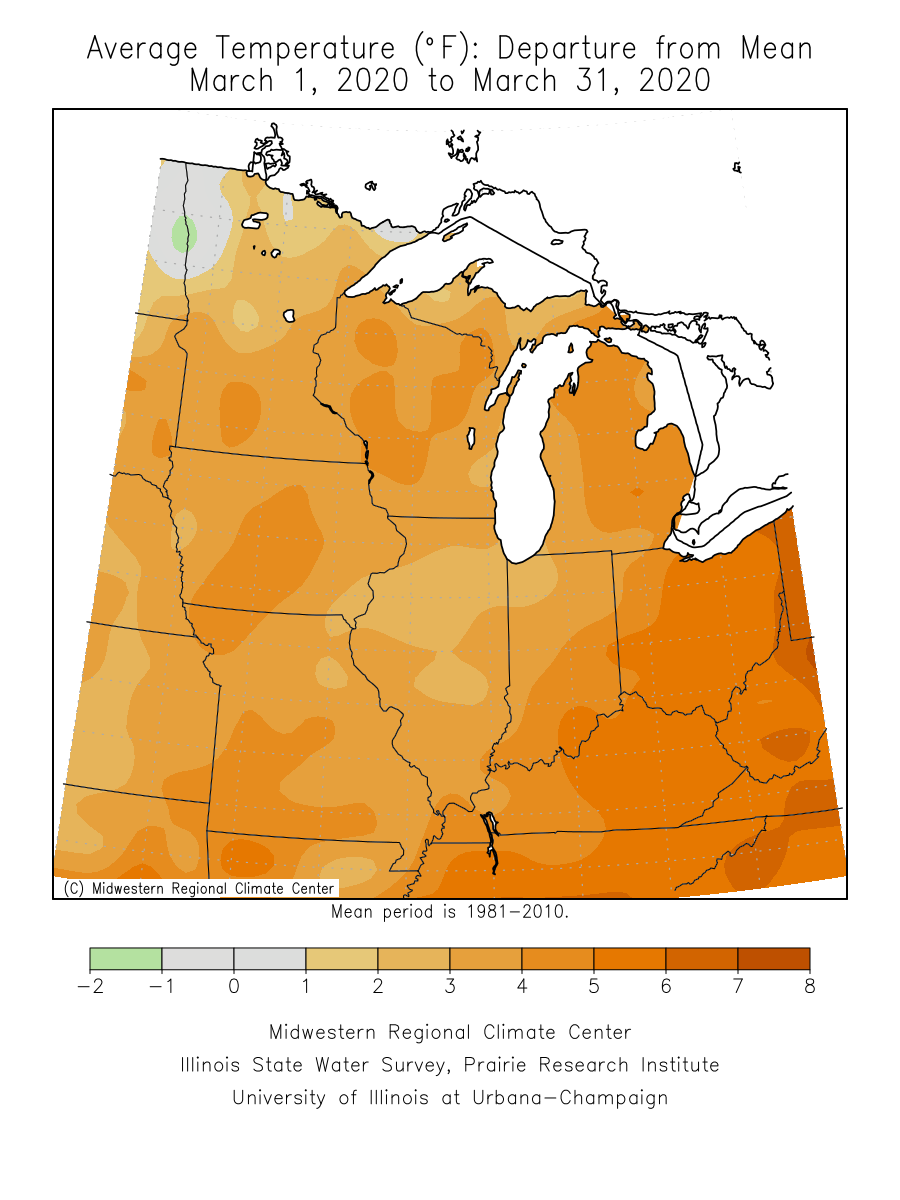
[see: Snow and Ice, April 1-3, 2020 ] - The state was split between winter and spring, with northwest Minnesota experiencing overall below normal temperatures, with well above temperatures in the central and south. March came in like a lamb and left like a lamb with above normal temperatures, but the middle of the month was relatively cool with some minimum temperatures below zero in the north. Statewide the preliminary average temperature was 2.9 degrees above normal. The coldest temperature found for the month was -30 at Cotton on March 2 and the warmest temperature found was 64 degrees on March 9 at Marshall, Pipestone and Windom. [see: Minnesota Climate Trends | March climate Summary Table | 2020 March Departure from Normal Temperature Map]
Where we stand now:
- With the general mild temperatures and the lack of snowfall in March the snow pack eroded from south to north during the month. Even the heavy snow event in early April in northwest Minnesota mostly melted away a week later. The only significant snowpack remaining is across the northland.
[see: MNDNR April Snow Depth Maps | NWS Snow Depth Estimation Map | Midwest Regional Climate Center Snow Depth Map] - The U.S. Drought Monitor map released on April 9 shows no drought designation in the state. Minnesota has been free of any drought designation since September 2019. The U.S. Drought Monitor index is a blend of science and subjectivity where drought categories (Moderate, Severe, etc.) are based on several indicators.
[see: Drought Conditions Overview] - After a record record-wet year in 2019, Minnesota's streams and rivers had a high potential for spring flooding, with major flooding possible across many parts of the state. Fortunately, a prolonged snowmelt, spanning several weeks in many areas, reduced the level of severity of flooding, and limited the resulting impacts. The Mississippi River at St. Paul crested at minor flood stage of an observed value of 14.41 feet on April 6. This was more than five feet lower than the crest from March 31, 2019. Locations along the Minnesota River have crested already, with the river levels now falling. The Red River at Fargo was nearing its crest in the moderate flood stage. The Red River at Grand Forks appears to have reached its crest of around 47.57 feet on April 10, which is about a half a foot higher than the crest in April 2019. Even with limited snowfall and well-timed melting, the Red River is the one major waterway in Minnesota to experience widespread major flooding: major flood stage at Grand Forks is 46 feet.
[see: Statewide USGS Stream Flow Conditions | Central Minnesota Rivers | Southeast Minnesota Rivers | Northwest Minnesota Rivers, including the Red River - Water levels on most Minnesota lakes vary depending on lake and location. Many larger lakes in the central and north are still ice-covered. Mille Lacs had above median lake levels at the time of freeze-up in the fall. Minnetonka was at 929.38 feet with 100 cfs flowing through Grays Bay Dam. White Bear Lake was at 925.09 feet on April 10, about the same as it was in the fall. Water has been flowing out of White Bear Lake since April 2019. Rainy Lake and Lake of the Woods were in the median range for early April. Lake Superior was forecasted to be at 602.40 feet on April 10, fourteen inches higher than the monthly average for early April and three inches below the highest recorded monthly mean for April set in 1986. Superior is forecasted to rise another three inches by early May.
[see: Mille Lacs Lake Water Level | Lake Minnetonka Water Level | White Bear Lake Water Level | Lake of the Woods Control Board Basin Data | Corps of Engineers Great Lakes Water Levels] - In its first report of the 2020 growing season, the Agricultural Statistics Service reported that topsoil moisture across Minnesota was 1 percent Very Short, 1 percent Short, 51 percent Adequate, and 49 percent Surplus. There were a few locations reporting some frost remaining in the soil.
[see: Agricultural Statistics Service Crop Progress and Condition] - The potential for wildfires is currently rated by DNR Forestry as Low across the south, northwest and northeast; Moderate in the central and north central; and High in parts of central Minnesota, to the northwest of the Twin Cities. Historically, 80 percent of all wildfires in Minnesota occur during April and May.
[see: Fire Danger Rating Map] - Lake ice out began during the last week of March, about a week to ten days earlier than the median. As of April 10, lake ice out had progressed into central Minnesota, a few days to a week earlier than historical median dates. 2020 lake ice out is running about two weeks earlier than in 2019.
[see: 2020 Lake Ice-Out Dates | DNR Conservation Officer Reports]
Future prospects:
- The April precipitation outlook indicates a greater than average chances of above-normal values across the state, with the highest probabilities in northwest Minnesota, heavy precipitation fell during the first two days of the month. Normal April precipitation ranges 1.5 inches in northwest Minnesota to around three inches in southeast counties. The historical probability of measurable precipitation for any given day in April ranges from 20 percent in the far northwest to 35 percent in the southeast.
[see: Climate Prediction Center 30-day Outlook | April Precipitation Normal Map] - The April temperature outlook favors near-normal temperatures over the entire state, with a slight tendency for above normal temperatures in the southeast. However, current forecast trends for much of the second half of April favor below normal temperatures, especially in the north. Normal April high temperatures are in the mid to upper 40s early in the month, rising to the low 60s by month's end. Early-April normal low temperatures are near 20 in the north, near 30 in the south. By month's end, low temperatures average in the mid-30s in the north, near 40 in the south.
[see: Climate Prediction Center 30-day Outlook | April Temperature Normal Map] - The 90-day precipitation outlook for April through June indicates a tilt to above-normal precipitation conditions especially south of a line from Fargo to Duluth. The April through June temperature projection favors above normal conditions.
[see: Climate Prediction Center 90-day Outlook]
From the author:
[see: Spring Phenology for Maplewood]
Upcoming dates of note:
- April 16: National Weather Service releases 30/90 day temperature and precipitation outlooks
![]() Subscribe to email announcements of the monthly posting of this product.
Subscribe to email announcements of the monthly posting of this product.
Pete Boulay MNDNR Climatologist